Facebook
 Twitter
 Pinterest
 Copy Link
2022 Holiday Happenings Around the Sound
As the days grow darker and rain settles in, a little holiday cheer couldn’t be better timed! Grab your umbrella and brighten your spirits with these Seattle-area favorites—whether it’s meandering through a dazzling light show, watching the “snow” fall at Bellevue’s Snowflake Lane, or taking a holiday-themed cruise. Here’s the skinny on dates, times, food, and parking…
Winterfest at Seattle Center
305 Harrison Street, Seattle, WA 98109
www.seattlecenter.com/winterfest
- Dates/Times: Nov. 25, 2022 – Dec. 31, 2022. Seattle Center Luminata with winter light & music display at International Fountain daily at 6pm; ice sculpting Nov. 27, Dec. 4, 11, & 18; Winter train & village open daily Nov. 25 – Dec. 31 | 10 am – 6 pm.
- Cost: Free for all ages.
- Parking: Paid parking available at the Mercer Garage, 5th Ave N Garage, and Theatre Commons ADA Lot. Click here for the campus map.
- Food: A multitude of dining options await you in the Armory.
- Special Events: Opening Day Celebration, live stage entertainment at the Armory, the Winter Train & Village, New Year’s Eve Celebration, and more!
- Holiday Closure: Dec. 25

Image courtesy of seattlecenter.com
Garden d’Lights at Bellevue Botanical Garden
12001 Main Street, Bellevue WA 98005
http://gardendlights.org
click here to get tickets (must be purchased in advance)
- Dates/Times: Open nightly Nov. 26, 2022 – Dec. 31, 2022 | 4:30 – 9:00 pm
- Cost: $8 per person (ages 10 and under are free)
- Parking: Premium parking is $5 per car in the Garden’s lot as space allows OR park for free at Wilburton Hill Park
- Food: Hot drinks and snacks are available for purchase
- Holiday Closures: December 25

Image courtesy of bellevuebotanical.org
Snowflake Lane at the Bellevue Collection
Bellevue Way & NE 8th Street, Bellevue WA 98004
http://snowflakelane.com/
- Dates/Times: Nightly Nov. 25, 2022 – Dec. 24, 2022 | 20 minute show starts at 7 pm
- Cost: Free for all ages
- Parking: Free parking at Bellevue Square, Bellevue Place and Lincoln Square
- Food: A variety of dining options (from happy hour, to kid fare, to gourmet) are all within walking distance
- Special Events & Activities: Ice Skating, Santa Photos

Image courtesy of snowflakelane.com
Christmas Ship Festival
Launch locations include Seattle Waterfront – Pier 55, Shilshole Bay Marina, Hyatt Regency Lake Washington, Lake Union Park (MOHAI), AGC Marina, Carillon Point Marina, and Kirkland City Dock.
www.argosycruises.com
click here to get tickets
- Dates/Times: Click here for the full schedule
- Cost: $40 – $72 per person (kids 3 and under are free)
- Parking: Varies by location – click here for details
- Food: Snacks and drinks available for purchase on the ship. Outside food/drinks are not allowed.
- Special Events: Opening Night, Parade of Boats, Grand Finale

Image courtesy of argosycruises.com
Westlake Center Tree Lighting & Holiday Activities
401 Pine St., Seattle, WA 98101 (Westlake Park)
https://downtownseattle.org/events/holidays/
https://downtownseattle.org/events/holidays
- Tree Lighting Celebration: Nov. 25 from 3-6 pm in Westlake Park.
- Holiday Lights & Delights: Nov. 25, 2022 – Jan. 8, 2023 in Occidental Square.
- Saturday Family Fun: Nov. 26, 2022 – Dec. 17, 2022 in Westlake Park.
- Cookies, Cocoa & Carolers: Nov. 26, 2022 – Dec. 17, 2022 | 11-3 in Occidental Square.
- Festive Friday Concerts: Dec. 2, 9 & 16 | 4-6 pm in Westlake Park.
- Cost: Free for all ages
- Parking: Access the Republic Parking garage from Olive Way between 4th & 5th Ave, or check out this interactive map of city parking

Photo Courtesy of Downtown Seattle Association
Zoolights at Point Defiance Zoo & Aquarium
5400 N Pearl St, Tacoma, WA 98407
www.pdza.org/event/zoolights
click here to get tickets
- Dates/Times: Open nightly Nov. 25, 2022 – Jan. 2, 2023 | 4:30 – 10 pm
- Cost: $12-$16 (free for kids 2 & under)
- Promotions: Discounted tickets for zoo members & BECU members
- Parking: Free parking in zoo lots (carpooling recommended)
- Food: Dinner, drinks & snacks are available at the Plaza Cafe & outside stands
- Activities: Carousel, Kids’ Zone with meerkats & goats
- Holiday Closures: Dec. 24 & 25

Image courtesy of https://www.pdza.org
WildLanterns at Woodland Park Zoo
West Entrance: 5500 Phinney Ave. N, Seattle, WA 98103
South Entrance: 750 N 50th St, Seattle, WA 98103
www.zoo.org/wildlanterns
Click here to get tickets
- Dates/Times: Open nightly Nov. 11, 2022 – Jan. 22, 2023 | 4:00 – 9:00 pm.
- Cost: $25.95 – $34.95 per person (ages 2 & under are free).
- Promotions: Zoo members get 20% off tickets.
- Parking: $6 parking is available in all lots after 3:30 pm. Park by the West Entrance if you are purchasing your tickets in person—the South Gate (Hippo Lot) is only for those who already have tickets.
- Food: Refreshments are available at food kiosks throughout, plus the Pizza Corner at 1899 Grove, and Gather & Graze Café (with covered seating provided). You are also welcome to bring your own food & non-alcoholic beverages.
- Special Activities: Tianyu Cultural Performances in the PACCAR Auditorium, Magical Memories Marketplace, & up-close Ambassador Animals in Australasia. Sensory-Friendly Nights on 11/16, 12/13 & 1/12.
- Closures: Mondays (except for Dec. 19 & 26); Nov. 24, Dec. 24 & 25.

Image courtesy of zoo.org
But wait, there’s more…
Holiday theatrical & musical shows
“A Christmas Carol” at ACT Theatre
“The Nutracker” by Pacific Northwest Ballet
“Winter Brilliance” at Chihuly Garden and Glass
The Polar Express train ride at Mt. Rainier Railroad
Gingerbread Village at the Sheraton Grand Seattle

© Copyright 2022, Windermere Real Estate/Mercer Island.
How’s the Market? Q3 2022 Real Estate Review

While still considered a seller’s market, our July-September home sale activity signaled the return of some much-needed balance. Seattle and Eastside home prices still posted year-over-year gains in Q3, but rising interest rates markedly slowed the pace of both listings and sales. Houses also stayed on the market longer than we saw during the frenzy earlier this year—the average Seattle home took 17 days to sell, while Eastside homes averaged 25 days to sell. Buyers have a great opportunity to negotiate better terms now with an eye out to refinance when interest rates come down in the future.
Click or scroll down to find your area report:
Seattle | Eastside | Mercer Island | Condos | Waterfront
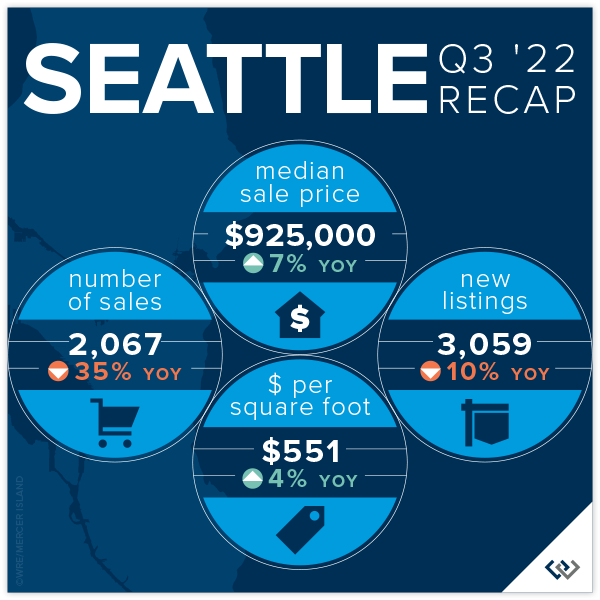
SEATTLE
There is a lot of good news in Seattle these days: Progress is being made in taking back downtown, the West Seattle Bridge is open AND real estate prices are UP year over year.
Transaction volume is down 35% across the city, which we can likely attribute to the volatility in interest rates, but listing volume is also down 10%. This is comforting! Supply and demand rules the market, and the last thing this balancing market needs is more inventory. We think this drop in seller enthusiasm is likely caused by the golden handcuffs of their historically low interest rates and refinance boom: even if your home isn’t meeting your needs these days, that 2.75% interest rate might be hard to give up.
Seattle’s average list/sold price ratio is 97%. This means if you listed your home for $1,000,000 you could expect to sell for $970,000 in Q3 of this year. Compare this with 82% on the Eastside. Seattle home sellers are more realistic and less affected by the price bloat of the last several years. We didn’t boom as hard, and we may not feel the impacts of a market balance as sharply either.
Click here for the full report and neighborhood-by-neighborhood statistics!

EASTSIDE
While we’re finally seeing the numbers reflect what the market has been feeling since May, it’s not as dire as one might think. Sales volume has slowed 38% year over year (based on total transaction count). However, new listings are also down (3%) which means the market reaching its peak has not sparked a sell off. This should keep our new normal buzzing along at pace similar to 2018 and 2019. Great homes that are priced right will sell—21% of homes sold above asking price and 40% of homes sold in the first 10 days.
Median list price is down 6% while median sales price is down 14.5%, which means homeowners looking to sell on the Eastside now have some data points to help them with realistic expectations of how to find the market. Average days on market is 25, which is higher than it’s been since Q1 of 2020! This is still slightly under the 6-year average. Don’t be tempted to think that there is something wrong with a home just because it has been on the market for a month; there are a lot of quality homes ready for their new owners.
The news of the day is interest rates. Heavy volatility in the markets and the administration’s drive to stem inflation have caused many buyers to pull out of the market. If you’re thinking you’ll wait for lower rates AND lower prices, you might be dreaming—if rates come down next year as predicted it will likely spur activity on. Our best advice: THIS is the market you’ve been waiting for. As a buyer you have choice, time and negotiating power for the first time since 2018. Capitalize! Then, refinance later.

Click here for the full report and neighborhood-by-neighborhood statistics!
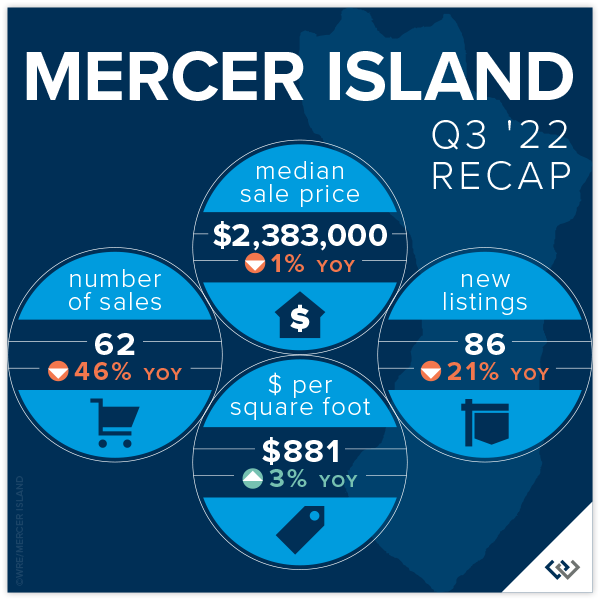
MERCER ISLAND
Given the broader local news, we might expect doom and gloom from Q3 stats—this expert sees lots of opportunity and much needed stabilization after the crazy COVID boom. While median prices have fallen 1% year over year, the average price per square foot is actually UP. What does this mean? Comparing a median with an average is always a little tricky, but this likely points to a slowdown in the sale of larger homes.
To me, the better signs of market predictability are the months supply of inventory for the quarter (about 6 weeks for both condos and single family) and the average days on market (18 for sf and 57 for condo). These are all relatively healthy benchmarks, even though they’re markedly higher than in previous quarters. This is what’s causing media to report doom and gloom: inventory is up sharply (there was ONE active listing at the end of Q4 2021 vs 44 at the end of Q3 2022) and pending sales are down (57 vs. 94 last year in the same time period). When you compare our current numbers to any time period outside of the last two years, we’re faring very well!
The news of the day is interest rates. Heavy volatility in the markets and the administration’s drive to stem inflation have caused many buyers to pull out of the market. If you’re thinking you’ll wait for lower rates AND lower prices, you might be dreaming—if rates come down next year as predicted it will likely spur activity on. Our best advice: THIS is the market you’ve been waiting for. As a buyer you have choice, time and negotiating power for the first time since 2018. Capitalize! Then, refinance later.
Click here for the full report and neighborhood-by-neighborhood statistics!

CONDOS – SEATTLE & EASTSIDE
Condos remain the tortoise as opposed to the hare like residential markets of 2020-early 2022. Slow and steady will definitely win this race as the affordability of homeownership shrinks with rising interest rates. Looking at combined condo data (Eastside + Seattle), months supply of inventory is down to about 6 weeks from 2 months last quarter. Low months supply of inventory and low cumulative days on market (23) are two of the leading indicators of market health, and both are as low or lower as they’ve been in the recent past.
Condo prices are also holding strong with no change to the average $ per square foot in Seattle and an overall 5% rise in median sale price year over year. The Eastside tells an even slightly better story: a 9% rise in $ per square foot and a 6% rise in median sale price despite a 41% year-over-year drop in the number of transactions.
Keep rooting for the tortoise. This is a necessary niche in our marketplace. The first rung on the property ladder is condos again for the first time in a long time, and we really hope our Gen Z and Millennial buyers take the leap!
Check out area-by-area details the full condo report.

WATERFRONT
The most affordable place to buy waterfront this quarter was Beach Dr in West Seattle at a closed sale price of $1,800,000 for 22’ of waterfront on an 11,000 sq. ft. lot. The largest piece of shoreline overall was 172 feet in Medina on Lake Washington, which commanded a sales price of $17,800,000.
This brief overview of the entire Seattle-Eastside private waterfront market, including Mercer Island and Lake Sammamish, illustrates the trends occurring in our region over time. This data is interesting and insightful but cannot replace an in-depth waterfront analysis provided by a savvy broker with years of local waterfront experience.
We earn the trust and loyalty of our brokers and clients by doing real estate exceptionally well. The leader in our market, we deliver client-focused service in an authentic, collaborative, and transparent manner and with the unmatched knowledge and expertise that comes from decades of experience.
© Copyright 2022, Windermere Real Estate/Mercer Island. Information and statistics derived from Northwest Multiple Listing Service and deemed accurate but not guaranteed.
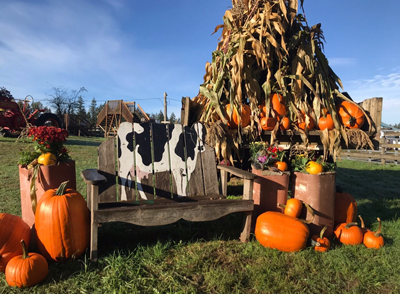
Favorite Local Pumpkin Patches

Grab your boots, pack a thermos…it’s time to choose those perfect Halloween pumpkins! This year, why not explore a new town and make your pumpkin patch experience a true adventure? All of these farms are open every weekend in October, and most are open on weekdays too. Some even welcome your furry family members on a leash. Scroll down for the full scoop!
Eastside | North of Seattle | South of Seattle
Eastside
Fletcher Farm
Dog-friendly with a scavenger hunt, farm animal zoo, storybook trail, mini-golf, photo stations, and junior corn maze for the little ones. End of season Halloween Bash, too!
18712 SE May Valley Road | Issaquah
fletcherfarmevents@gmail.com
fletcherfarmissaquah.com

Jubilee Farm
Hay rides, food trucks, music, hay maze, & hot apple cider.
229 W Snoqualmie River Rd NE | Carnation
(425) 222-4558
jubileefarm.org

Novelty Hill Farm
Dog-friendly! Corn maze, farm animals, trike track, & games.
26617 NE 124th Street | Duvall
(425) 788-2416
noveltyhillfarm.com

Oxbow Farm & Conservation Center
Live music, scavenger hunt, hay rides, mini pumpkin decoration, climbing tractor, conservation tours, & apple slingshot.
10819 Carnation-Duvall Rd. NE | Carnation
(425) 788-1134
oxbow.org/oxtober

Remlinger Farms
25 rides & attractions for children (including a train, carousel, & mini roller-coaster!), pony rides, apple cannon, restaurant, & new brewery with 20 choices on tap.
32610 NE 32nd Street | Carnation, WA
(425) 451-8740
remlingerfarms.com

Serres Farm
Mini train rides, corn maze and a dazzling variety of specialty pumpkins.
20306 NE 50th St | Redmond, WA
(425) 868-3017
serresfarm.com/pumpkin-patch

Two Brothers Pumpkins at Game Haven Farm
Baby calves and an eerie number of well-attired scarecrows.
7110 310th Avenue NE | Carnation, WA
(425) 333-4313
facebook.com/twobrotherspumpkins
North of Seattle
Bailey Vegetables
Kettle corn, cider, U-pick apples, baked goods, and kids play area with hay run, farm trikes & sandbox.
12691 Springhetti Rd | Snohomish
(360) 568-8826
baileyveg.com/pumpkin-patch

Bob’s Corn & Pumpkin Farm
12-acre corn maze, 2 kids’ mazes, play barn, hay rides, trike track, & apple cannon. Fire pit rentals for private groups, too!
10917 Elliott Road | Snohomish
(360) 668-2506
bobscorn.com/pumpkins

Carleton Farm
5-acre corn maze, playground, paintball gallery, apple guns, hay rides, & kids’ bucket train.
630 Sunnyside Blvd SE | Lake Stevens, WA
(425) 343-4963
carletonfarm.com/fall-fun

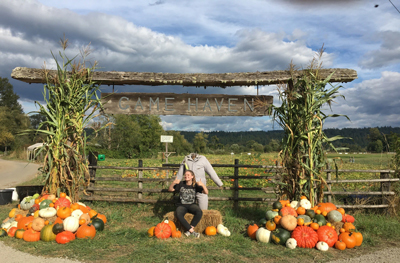
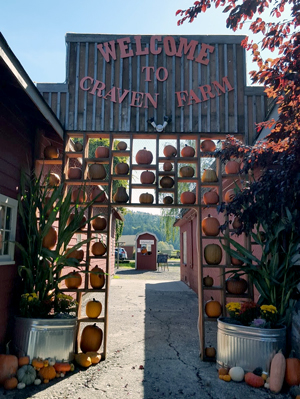
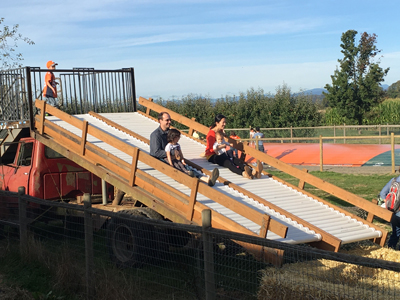
Craven Farm
15-acre corn maze, kids maze, farm animals, mini golf, cow train, foosball, espresso, cider donuts, & scarecrow making. Fire pit rentals and special dog-friendly days, too!
13817 Short School Road | Snohomish
(360) 568-2601
cravenfarm.com/fall-festival
Fairbank Animal & Pumpkin Farm
Lots of baby animals, “corn maize maze,” hay tunnel, toy duck races, photo boards, & veggie garden.
15308 52nd Ave W | Edmonds
(425) 743-3694
fairbankfarm.com

Stocker Farms
30+ attractions including a giant jumping pillow, tire mountain, epic play area, zip line, corn maze, pumpkin cannon, & more. The farm’s evil twin, Stalker Farms, comes out at night.
8705 Marsh Rd | Snohomish
(360) 568-7391
stockerfarms.com

Swans Trail Farms
Washington State corn maze, kids corn maze, petting farm, wagon rides, big slides, zip lines, u-pick apple orchard & live duck races.
7301 Rivershore Rd | Snohomish
(425) 330-3084
swanstrailfarms.com
South of Seattle
Carpinito Brothers Corn Maze & Pumpkin Patch
Rubber duck races, hay slides, corn pit, farm animals, hay maze, & corn maze.
Pumpkin Patch: 27508 W Valley Hwy N | Kent
Farm Fun Yard: 6720 S 277th St | Kent
(253) 854-5692
carpinito.com

Maris Farms
Racing pigs & ducks, mega slide, corn maze, jump pillow, animals, zip lines, rides, plus the creepy “Haunted Woods” complete with zombies and homicidal maniacs.
25001 Sumner-Buckley Highway | Buckley
(253) 862-2848
marisfarms.com

Mosby Farms
Dog-friendly! Corn maze and fresh farm market.
3104 SE Auburn-Black Diamond Rd | Auburn
(253) 405-0711
mosbyfarm.com/pumpkinpatch

Spooner Farms
Corn maze, pumpkin sling shot, speedway, farm animals, caramel apples, & roasted corn.
9710 State Route 162 East | Puyallup
(253) 840-2059
spoonerberries.com

Thomasson Family Farm
Laser tag, corn maze, play barn, farm animals, slides, duck races, trike track, apple slingshot, and giant Jenga & Connect 4.
38223 236th Avenue SE | Enumclaw
(360) 802-0503
thomassonfarm.com
We earn the trust and loyalty of our brokers and clients by doing real estate exceptionally well. The leader in our market, we deliver client-focused service in an authentic, collaborative, and transparent manner and with the unmatched knowledge and expertise that comes from decades of experience.
2737 77th Ave SE, Mercer Island, WA 98040 | (206) 232-0446
mercerisland@windermere.com
© Copyright 2022 Windermere Mercer Island
2022 Football Schedules, Recipes & Tips…
Are you ready for some football? Fall is just around the corner and tickets are on sale now for 12s ready to cheer on a new era of promising rookies, as well as UW & WSU fans ready to show their college spirit. Scroll down for printable schedules, tailgating hacks (including how to pack the perfect cooler!), our favorite gameday recipes, and printable bingo cards to keep even the youngest fans entertained…


We earn the trust and loyalty of our brokers and clients by doing real estate exceptionally well. The leader in our market, we deliver client-focused service in an authentic, collaborative, and transparent manner and with the unmatched knowledge and expertise that comes from decades of experience.
2737 77th Ave SE, Mercer Island, WA 98040 | (206) 232-0446
mercerisland@windermere.com
© Copyright 2022 Windermere Mercer Island
Kicks for Kids Shoe Drive August 8-19
Help us give kids the confidence they need to start the school year right! Windermere Mercer Island invites you to participate in our Kicks for Kids back-to-school sneaker drive. It connects low-income youth in our local communities with new shoes for the upcoming school year. Between August 8th and 19th, we’ll be accepting donations two ways:
-
Bring new or gently used sneakers (toddler/youth sizes) to my office at 2737 77th Ave SE, Ste. 100, Mercer Island. We’ll enter your name into a raffle for a delectable prize from Island Treats, and we’ll also match the first 100 pairs of shoes donated!
-
Shop from our Amazon Wishlist.

This year, we’re partnering once again with the Eastside Baby Corner, an amazing organization that helps kids thrive by providing resources and essentials with their 70+ partner agencies—many of which are school districts.
Help us make sure every child has a new pair of shoes for school!


We earn the trust and loyalty of our brokers and clients by doing real estate exceptionally well. The leader in our market, we deliver client-focused service in an authentic, collaborative, and transparent manner and with the unmatched knowledge and expertise that comes from decades of experience.
2737 77th Ave SE, Mercer Island, WA 98040 | (206) 232-0446
mercerisland@windermere.com
© Copyright 2022 Windermere Mercer Island
How’s the Market? Q2 Real Estate Review

While Seattle and the Eastside are still considered a seller’s market, buyers experienced some much-needed relief in the second quarter with new listings outpacing the number of homes sold. Rising interest rates have initiated a shift toward a more balanced market. Opportunities abound for both sellers (who are still seeing higher sales prices than this time last year) and buyers (who finally have some breathing room to negotiate price and contingencies). We expect this shift to continue with a stabilization of home prices rather than the steep upward trajectory we saw last year.
Click or scroll down to find your area report:
Seattle | Eastside | Mercer Island | Condos | Waterfront
SEATTLE
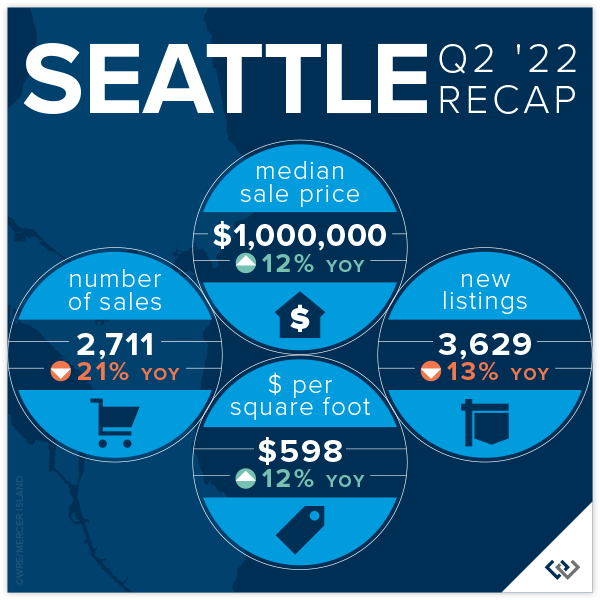
The Seattle real estate market for single family homes is holding steady despite rising interest rates and slowdowns elsewhere in King County! The median sale price is up 9% since the end of 2021 (from $910,000 to $1,000,000). Year over year, the median price rose from $895,000 in Q2 2021 to $1,000,000 in Q2 2022 (also roughly 12%).
Anecdotally, we believe that Seattle continues to gain ground because it remains affordable when compared to the cities and neighborhoods to the east. Eastside median prices rose so sharply over the last two years that it left Seattle “in the dust” as the market leader of the region. As we know, slow and steady wins the race, though there is no way to know yet if this particular race is a marathon or a sprint.
Interest rates nearly doubled in Q2, though that seems to leave Seattle home shoppers undeterred. 86% of the sales in Q2 sold in the first 10 days at an average of 110% of list price.
Click here for the full report and neighborhood-by-neighborhood statistics!
EASTSIDE
Relief has finally come to home shoppers on the Eastside! New listings are up 13% year over year. Further, there has been a slide in total number of sales, down 18% year over year. This means there are more choices for anyone who is in the market to buy a home. Price gains remain steady for now, up 22% over Q2 of 2021. This is likely riding the wave of growth in late 2021 and early 2022, but with the higher supply and lower demand this is may be a trend that tapers off in the near future.
Average price per square foot saw its first quarterly drop since Q2 of 2019, down from $713 in Q1 to $685. The overall median price fell from a high of $1,625,000 in Q1 to $1,610,000 in Q2. Even more exciting for home buyers is that (when in competition) the list to sales price ratio is 109%— down from 119% in Q1.
If you’ve thought about selling your home, it’s still a great time. When a home is prepared well and priced right shoppers pay attention. Of the 2177 homes sold in Q2, 84% of those sold in the first 10 days. This isn’t far off of the 90% that was posted in Q1. It is harder to get noticed today than in recent memory—this is where choosing a true professional to partner with is so important! Windermere brokers have their fingers on the pulse and know how to make you stand out in a crowd!

Click here for the full report and neighborhood-by-neighborhood statistics!

MERCER ISLAND
Mercer Island continues to be a fabulous place to be a homeowner. Median prices and price per square foot both saw increases over Q1 2022 numbers (6.5% and 5% respectively). Anecdotally, there has been a pace change. We don’t expect that to reflect in the stats until Q3, and even then the numbers are likely to be favorable as we gained so much ground in Q1 of this year.
The data that supports what we’re all feeling can be found in the relationship between number of new listings and number of homes sold. In Q2, there were 116 new listings and 84 sales compared to the same period in 2021 when we had 124 new listings and 102 sales. So, if you’re feeling like inventory is “up,” it’s not because more homeowners are deciding to sell but rather it appears that demand is down. Another way to look at this is that we sold 82% of the active inventory in spring of 2021 but only 72% in 2022. These are healthy numbers but it’s enough of a drop for us to feel it.
If you’re a buyer trying to break in to the Mercer Island market, it’s getting easier. 83% of the 116 new listings sold within the first 10 days for an average of 111% of the asking price. This is the most favorable these numbers have been since 2019. Working with a local pro will be your biggest advantage to determine which homes will sell at a premium and how to get the best deal!

Click here for the full report and neighborhood-by-neighborhood statistics!

CONDOS – SEATTLE & EASTSIDE
Condo average prices have seen their biggest quarterly rise since Q3 of 2016! As home shoppers adjust expectations amidst rising interest rates, the affordability offered by condos is an exciting place to turn. We are thrilled to see condos be a viable option as we recover from the pandemic and buyers return to more densely populated areas.
North Seattle (up 34%) and Capitol Hill (up 10%) are bright spots in the total number of condos sold year over year for Seattle. This makes perfect sense as both areas offer access to our growing light rail system and new retail opportunities that didn’t exist pre-pandemic. Seattle’s total sales year over year remained flat, literally zero, which means these two neighborhoods carried the entire city.
The same data point on the Eastside saw the entire area’s total number of sales fall 27% year over year. West Bellevue (down 51%) and Mercer Island (down 38%) topped the list. Meanwhile, prices on the Eastside are up an average of 20%.
Check out area-by-area details the full condo report.
WATERFRONT
Waterfront season is heating up. As expected, inventory is up from Q1 (32 total sales in Q2 v 17 in Q1), but what hasn’t changed is an average of only 6 listings for sale at any one time across all shorelines! Of all of the waterfront shorelines, Mercer Island boasted the lowest days on market with an average of just THREE days. Seattle had the highest days on market, with an average of 41 days.
The most affordable place to buy waterfront this quarter was Beach Dr in West Seattle at a closed sale price of $1,800,000 for 25’ of waterfront on a 17,000 sq. ft. lot. The largest piece of shoreline overall was 177 feet in Issaquah on Lake Sammamish, which commanded a sales price of $11,600,000.
This brief overview of the entire Seattle-Eastside private waterfront market, including Mercer Island and Lake Sammamish, illustrates the trends occurring in our region over time. This data is interesting and insightful but cannot replace an in-depth waterfront analysis provided by a savvy broker with years of local waterfront experience.
We earn the trust and loyalty of our brokers and clients by doing real estate exceptionally well. The leader in our market, we deliver client-focused service in an authentic, collaborative, and transparent manner and with the unmatched knowledge and expertise that comes from decades of experience.
© Copyright 2022, Windermere Real Estate/Mercer Island. Information and statistics derived from Northwest Multiple Listing Service and deemed accurate but not guaranteed.
How’s the Market? Q1-2022 Real Estate Review

Across the region, home values continued to see huge year-over-year gains from 2021 to 2022. Most homes sold in the first 10 days and for well above the asking price. We started the year with an extreme shortage of homes for sale, resulting in an overall lower number of sales compared to the start of 2021. Buyer demand, however, remains incredibly strong.
With interest rates on the rise, buyers are feeling more pressure than ever to secure a home. We are hoping to see more listings come to market this spring and provide some much needed relief for weary house hunters.
Click or scroll down to find your area report:
Seattle | Eastside | Mercer Island | Condos | Waterfront
SEATTLE
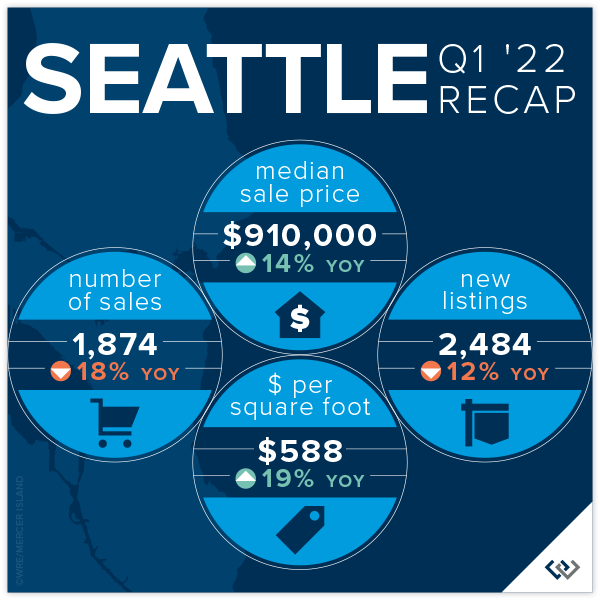
The Seattle real estate market for single family homes is off and running! The median sale price is up 6% since the end of 2021. Which means: Seattle’s price gains were as much in the first quarter as all of 2021. Year over year, the median price rose from $800,000 in Q1 2021 to $910,000 in Q1 2022.
For anyone who has focused their home search on the Eastside and has come up empty handed in 2021, Seattle could seem like an affordable opportunity this year. Seattle’s price gains were strong, albeit conservative in comparison with the Eastside. More plentiful active inventory (relatively speaking), and a more affordable median sale price of $910,000 (vs $1,625,000 on the Eastside) indicate that Seattle could be a bright spot of hope for any buyers left behind by the Eastside’s double-digit gains.
Rising interest rates in late Q1 are sure to play a part in the weary home buyer’s decision-making process. However, the close of quarter numbers are encouraging: 82% of homes sold in the first ten days!
Click here for the full report and neighborhood-by-neighborhood statistics!
EASTSIDE
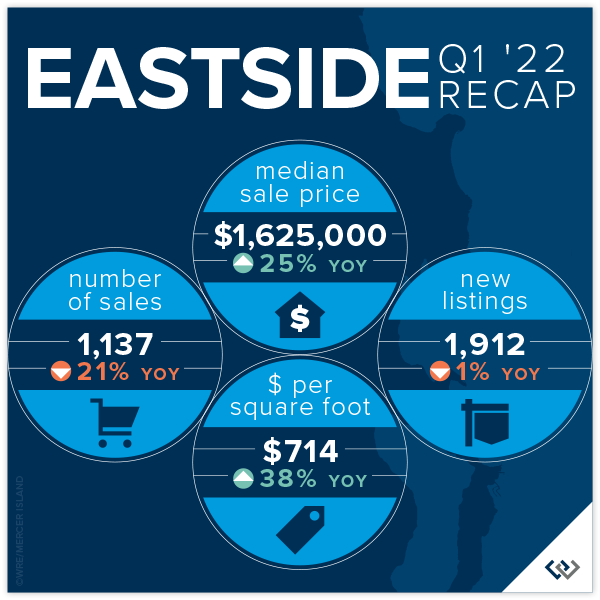
Once again Eastside Real Estate is off to an incredible start in the first 3 months of the year. Multiple offers and wildly aggressive escalation clauses are the story of the day, and not just anecdotally—the numbers don’t lie. The average list to sale price ratio was a staggering 119%, which means the typical home listed at $1,000,000 sold for closer to $1,190,000. This is an even stronger showing than the previous record high of 112% in Q1 of 2021.
New listings were relatively flat compared to Q1 of 2020 and 2021 (1912 vs 2058 and 1935 respectively) while the total number of sales were down 21% (1137 vs 1413 in the prior year). We believe this can be explained by looking at the trailing inventory from the previous Q4 in both cases (1496 vs 1238). There were just fewer homes for sale, certainly not less demand. This was reflected in the overall price gain of 25%!
Without a crystal ball it will be tough to tell exactly how much impact the market will feel from the steep rise in interest rates. In the short term, everyone seems to be taking a deep breath as we move into Q2. Overall, the Eastside’s core values—highly ranked schools, community focused neighborhoods, and close commute proximity to some of the area’s largest employers—should keep the area in high demand!
Click here for the full report and neighborhood-by-neighborhood statistics!

MERCER ISLAND
Mercer Island by the averages was quite shocking in Q1 of 2022: 3 homes per sale per week, 11 days on market, and 111% list price to sale price. This translates to buyers who would have otherwise joined our community casting a wider net to places like Bellevue, Issaquah, and Sammamish.
One of the affordability indicators that we historically track has become obsolete over the past few quarters: number of homes listed/sold under $1,000,000. In fact, there was only one home listed under $1,500,000 in Q1. 21 of the 39 homes had sale prices above $2,000,000 and 9 were above $3,000,000!
If you’re a buyer trying to break into the Mercer Island market, patience and the ability to act fast are the top two tips we have for you. 85% of the 39 homes for sale in Q1 sold within the first 10 days. Working with a local pro will be your biggest advantage.

Click here for the full report and neighborhood-by-neighborhood statistics!

CONDOS – SEATTLE & EASTSIDE
Condos continue to gain ground early in 2022. While the year-over-year median price gains are conservative compared to the single-family market, we see this as a good thing! Condos are a bright spot for today’s home buyers as interest rates rise.
Seattle condos saw a 9% increase (to $519,000). Eastside condos are up 16% (to $625,000) a 26% lift in price per square foot compared to Q1 2021.
Shoreline and East Bellevue led the market in median price gains year over year, up 66% and 48% respectively. Queen Anne and Kirkland were the most conservative with 1% and 4% gains respectively. 85% of Eastside condos sold over the list price, so if you’re shopping be prepared to compete.
Check out area-by-area details the full condo report.
WATERFRONT
If the first three months are any indication, it will be a tight inventory year in the Waterfront real estate market. On all shorelines, there were a total of 17 homes sold overall with an average of only 6 listings for sale at any one time. The good news is that we’re up from this time last year when there were only 14 homes sold overall.
Notably, the highest overall sale (at $12,750,000) was on Lake Sammamish in Issaquah! The most affordable waterfront this quarter was a home in Rainier Beach that sold for $1,362,500.
This brief overview of the entire Seattle-Eastside private waterfront market, including Mercer Island and Lake Sammamish, illustrates the trends occurring in our region over time. This data is interesting and insightful but cannot replace an in-depth waterfront analysis provided by a savvy broker with years of local waterfront experience.
We earn the trust and loyalty of our brokers and clients by doing real estate exceptionally well. The leader in our market, we deliver client-focused service in an authentic, collaborative, and transparent manner and with the unmatched knowledge and expertise that comes from decades of experience.
© Copyright 2022, Windermere Real Estate/Mercer Island. Information and statistics derived from Northwest Multiple Listing Service and deemed accurate but not guaranteed.
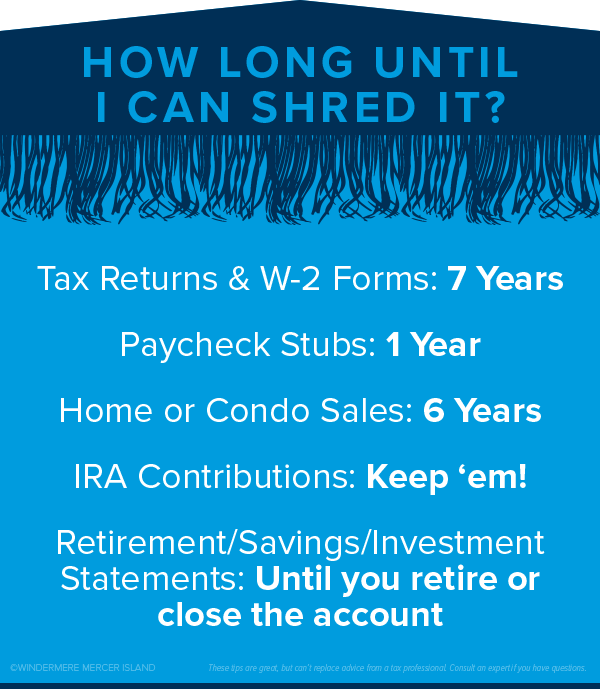
Free Paper Shredding on Saturday, May 14th

Ready for some eco-friendly catharsis…with doughnuts? Yeah, us too. Bring those old tax returns, bills, embarrassing photos, and more to our parking lot on Saturday, May 14th…you can enjoy the sight of them being shredded to ribbons while you score a Top Pot doughnut. It’s free, all those shreds get recycled, AND we’re accepting donations for the Windermere Foundation’s $50 Million in 50 Years campaign (should you need some fresh, good karma after exorcising your demons). Come join us before the doughnuts run out:
Saturday, May 14th
9am – 2pm
2737 77th Avenue SE, Mercer Island
Sponsored by Windermere Mercer Island | Benefiting the Windermere Foundation!

We earn the trust and loyalty of our brokers and clients by doing real estate exceptionally well. The leader in our market, we deliver client-focused service in an authentic, collaborative, and transparent manner and with the unmatched knowledge and expertise that comes from decades of experience.
© Copyright 2022, Windermere Real Estate/Mercer Island.
Should You Remodel or Sell Your Home As Is?

Homeowners who are preparing to sell are often faced with a dilemma about whether to remodel or sell their home in its current state. Each approach has its respective advantages and disadvantages. If you decide to remodel your home, it will likely sell for more; but the increased selling price will come at the cost of financing the remodeling projects. If you decide to sell without remodeling, you won’t spend as much money putting your home on the market, but the concern is whether you’re leaving money on the table.
Should I Remodel or Sell My Home As Is?
To answer this question, it’s important to understand the factors that could influence your decision and to work closely with your agent throughout the process.
Cost Analysis: Home Remodel vs. Selling Your Home As Is
Home Remodel
When you remodel your home before selling, you’re basically making a commitment to spend money to make money. So, it’s important to consider the kind of ROI you can expect from different remodeling projects and how much money you’re willing to spend. Start by discussing these questions with your agent. They can provide you with information on what kinds of remodels other sellers in your area are making and the returns they’re seeing as a result of those upgrades. This will help you determine the price of your home once your remodel is complete.
Then, there’s the question of whether you can complete you remodeling projects DIY or if you’ll need to hire a contractor. If hiring a contractor seems expensive, know that those costs come with the assurance that they will perform quality work and that they have the skill required to complete highly technical projects.
According to the Remodeling 2021 Cost vs. Value Report for Seattle (www.costvsvalue.com1), on average, Seattle-area homeowners paid $28,967 for a midrange bathroom remodel and $29,183 for a minor kitchen remodel, with a 76.9% and 87.7% ROI respectively. This data shows that, for these projects, you can recoup a chunk of your costs, but they may not be the most cost-effective for you. A more budget-friendly approach to upgrading these spaces may look like repainting your kitchen cabinets, swapping out your old kitchen backsplash for a new one, refinishing your bathroom tub, or installing a new showerhead. Other high-ROI remodeling projects may allow you to get more bang for your buck, such as a garage door replacement or installing stone veneer. To appeal to sustainable-minded buyers, consider these 5 Green Upgrades that Increase Your Home Value.

Selling Your Home As Is
Deciding not to remodel your home will come with its own pros and cons. By selling as is, you may sell your home for less, but you also won’t incur the cost and headache of dealing with a remodel. And since you’ve decided to sell, you won’t be able to enjoy the fruits of the remodel, anyway. If you sell your home without remodeling, you may forego the ability to pay down the costs of buying a new home with the extra money you would have made from making those upgrades.
Market Conditions: Home Remodel vs. Selling Your Home As Is
Local market conditions may influence your decision of whether to remodel before selling your home. If you live in a seller’s market, there will be high competition amongst buyers due to a lack of inventory. You may want to capitalize on the status of the market by selling before investing time in a remodel since prices are being driven up, anyway. If you take this approach, you’ll want to strategize with your agent, since your home may lack certain features that buyers can find in comparable listings. In a seller’s market, it is still important to make necessary repairs and to stage your home.
In a buyer’s market, there are more homes on the market than active buyers. If you live in a buyer’s market, you may be more inclined to remodel your home before selling to help it stand out amongst the competition.
Timing: Home Remodel vs. Selling Your Home As Is
Don’t forget that there is a third option: to wait. For all the number crunching and market analysis, it simply may not be the right time to sell your home. Knowing that you’ll sell your home at some point in the future—but not right now—will allow you to plan your remodeling projects with more time on your hands which could make it more financially feasible to complete them.
For more information on how you can prepare to sell your home, connect with one of our local agents—we’re always happy to chat about your situation and offer advice.
1©2021 Zonda Media, a Delaware corporation. Complete data from the 2021 Cost vs. Value Report can be downloaded free at www.costvsvalue.com.
This article originally appeared on the Windermere blog January 10, 2022. Written by: Sandy Dodge.
We earn the trust and loyalty of our brokers and clients by doing real estate exceptionally well. The leader in our market, we deliver client-focused service in an authentic, collaborative, and transparent manner and with the unmatched knowledge and expertise that comes from decades of experience.
© Copyright 2022, Windermere Real Estate/Mercer Island.