
 Facebook
 Twitter
 Pinterest
 Copy Link
Q2 2020 Reports: Market Update

Q2 was a story of resilience for the Seattle market. It began with our region fully entrenched in a new normal amidst the COVID-19 pandemic, but ended with a strong seller’s market and historic low interest rates. Buyers have returned in droves to battle for the limited supply of homes for sale. With a shortage of listings due both to economic/health concerns and sellers who can’t find anywhere to go, we could double our current supply of homes for sale and still fall short of demand.
Our region’s typical peak season was delayed with April feeling more like February and picking up momentum through the end of June. Possibly motivated as much by the changing home requirements of our newly revised lifestyles as it is by the opportunity to snag a coveted mortgage interest rate (a 1% change in interest rate equates to a 10% change in buying power), buyers are eager to find a place to call home.
Residential home prices are generally up throughout the region in Q2 while condominium prices are mixed depending on the building amenities and how well they have addressed COVID-19 concerns.
Click or scroll down to find your area report:
Seattle | Eastside | Mercer Island | Condos | Waterfront
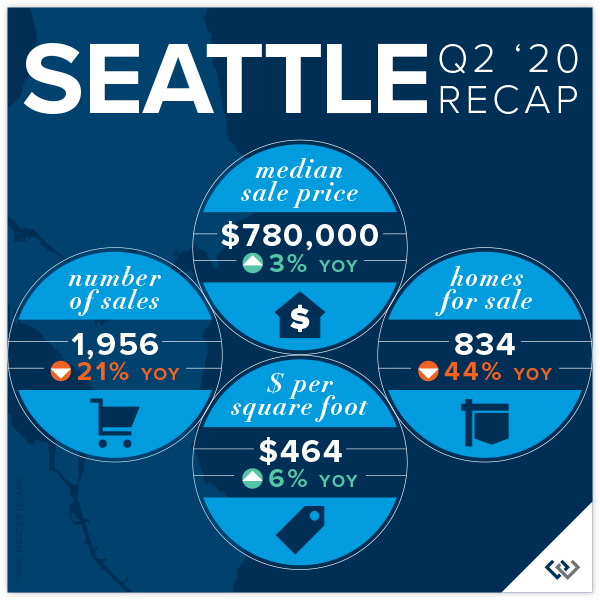
SEATTLE
Seattle’s median sale price increased by 3% in Q2 to $780,000. Queen Anne-Magnolia (+8%) and South Seattle (+7%) were top performers in the Seattle region while the Richmond Beach-Shoreline area was down 1% compared to Q2 2019.
68% of Seattle homes (all price points) sold at or above their listed price, while only 15% of homes priced above $1 million did so. The average number of days to sell decreased to 20 from 27 in Q2 of the year prior. There were 21% fewer Seattle home sales in Q2 2020 (1,956) compared to Q2 2019 (2,479) due to a shortage of homes for sale.
The highest Seattle home sale was a 2008-built Laurelhurst (North Seattle) waterfront home for $10,500,000 and the lowest was a 1979-built 1-bedroom approved floating home in a leased slip on Lake Union for $134,000..
Click here for the full report and neighborhood-by-neighborhood statistics!
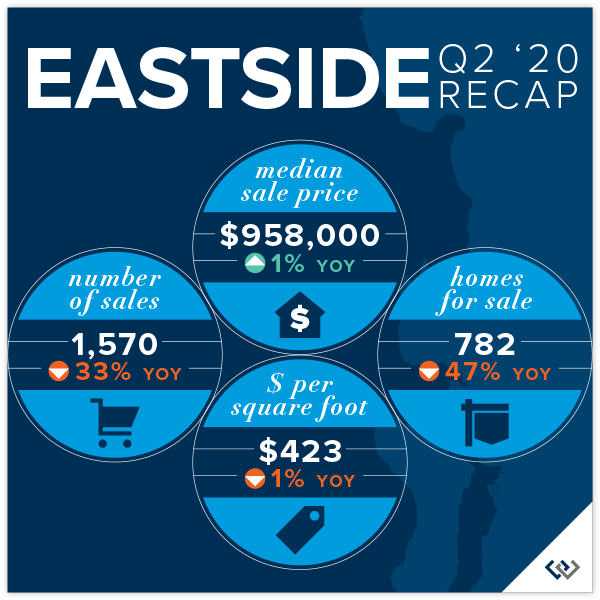
EASTSIDE
The Eastside median sale price was $958,000 in Q2, up 1% over Q2 2019. West Bellevue (+10%) and East Bellevue (+8%) performed best, while Mercer Island saw an 11% decrease in its median sale price with fewer luxury sales.
65% of Eastside homes, and 26% of homes priced above one million dollars, sold for at or above their listed price. The average number of days to sell decreased to 24 from 36 in Q2 of the year prior. There were 33% fewer Eastside home sales in Q2 2020 (1,570) compared to Q2 2019 (2,334) due to fewer homes available for sale.
The highest sale was a $11.75 million 2004-built Evergreen Point shared waterfront home on just over an acre and the lowest sale was a 1924 Skykomish cabin on Old Cascade Hwy.
Click here for the full report and neighborhood-by-neighborhood statistics!

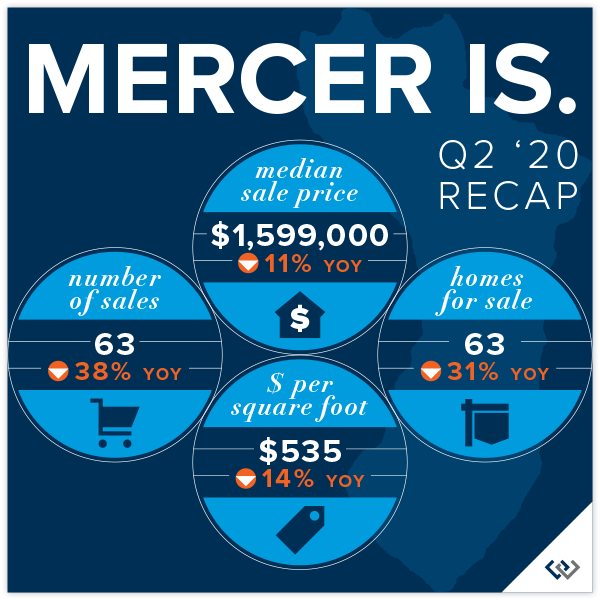
MERCER ISLAND
There was not a single Mercer Island home sale below $1 M in Q2. The bulk of Island sales were in the $1.2 M to $2 M price point (40 of 63 sales) and there were only four sales above $3 M.
The Island’s record shortage of homes for sale in Q2 continues to create a bottleneck of buyer activity with multiple offers common in the $1.2 M to $2 M segment of the market. Buyers are winning the competition by pre-inspecting and waiving typical contingencies more so that drastically escalating offer prices.
52% of all homes, and 8% of homes priced above two million dollars, sold for at or above their listed price. The highest Mercer Island sale was a $4.185 million, 2002-built Eastside waterfront home. Two “as-is” mid-island homes tied for the lowest sale of at $1,000,000.
Click here for the full report and neighborhood-by-neighborhood statistics!
CONDOS – SEATTLE & EASTSIDE
Condo sales have been more impacted by COVID-19 concerns than most residential homes. Condo buildings with individual outside access and those with stellar cleanliness policies tended to be more desirable than buildings that did not clearly address exposure concerns.
The Seattle median condo sale price was down 6% to $455,000 in Q2 as compared to Q2 2019 ($483,500). There were only 468 sales for the quarter vs. 764 sales in the same quarter last year. Downtown-Belltown condos (+6%) outperformed the region while Richmond Beach & Shoreline condos were down 20% over Q2 of the prior year (fewer higher end sales). 55% of Seattle condos (all prices), and 4% of condos priced above one million dollars, sold for at or above their listed price.
On the Eastside, the median sale price was up 9% to $525,000 (from $460,000 in Q2 2019). East Bellevue (+21%) and Redmond (+19%) condos far outpaced gains seen in surrounding cities. A total of 440 units sold on the Eastside this quarter. 65% of all Eastside condos, and 6% of those priced above one million dollars, sold for at or above their listed price.
Check out all of these factoids and more in the full condo report.
WATERFRONT
Sales of waterfront homes in Q2 with exclusive (not shared) access to the water picked up some momentum after a sleepy Q1 but remain far below typical norms. Seattle had 12 private waterfront home sales while Mercer Island and Lake Sammamish each had 5 sales and the Eastside had 4 sales.
Six (23%) of the 26 total sales closed at higher than their listing price, including one West of Market sale that went for $2 M above its listed price. Three sales (12%) closed right at their listed price and 17 (65%) closed below their listed price. Homes sold above their listed price sold in an average of 27 days for 11% higher than list. Homes sold below their listed price sold in an average of 125 days for 6% less than their listed price.
The highest Q2 private waterfront sale was in Laurelhurst at $10.5 million with 145 feet of Lake Washington waterfront. The most affordable was a $1.6 million West Lake Sammamish home with 50 feet of waterfront on the lake.
This top-level overview of the entire Seattle-Eastside private waterfront market, including Mercer Island and Lake Sammamish, provides a glance into the trends occurring in our region over time. Interesting, and certainly insightful, it in no way replaces an in-depth analysis on waterfront value provided by a savvy broker with years of local waterfront experience.

Find a Home | Sell Your Home | Property Research
Neighborhoods | Market Reports | Our Team
We earn the trust and loyalty of our brokers and clients by doing real estate exceptionally well. The leader in our market, we deliver client-focused service in an authentic, collaborative and transparent manner and with the unmatched knowledge and expertise that comes from decades of experience.
2737 77th Ave SE, Mercer Island, WA 98040 | (206) 232-0446 mercerisland@windermere.com
© Copyright 2020, Windermere Real Estate/Mercer Island. Information and statistics derived from Northwest Multiple Listing Service and deemed accurate but not guaranteed.
Q1 2020 Reports: Market Update

As we are fully entrenched in a new normal amidst the COVID-19 pandemic, it is important to note that the Q1 stats you see are based on pre-coronavirus closed sales activity and therefore largely untouched by our current market reality.
While Q1 serves as a pre-coronavirus benchmark, Q2 and Q3 will more accurately show the impacts of the (necessary) stay home order and resulting economic fallout. Our region stands to rebound more quickly than many US markets due to its pre-coronavirus strength.
Q1 saw a continued inventory shortage, although many homes were just queuing up to come on the market prior to the outbreak. Mortgage interest rates hit new lows in March (down about 1% from a year ago) bringing the typical monthly payment down significantly. For reference, a 1% change in interest rate equates to about a 10% change in buying power (i.e. an $800,000 home at 3.4% costs about the same per month as a $720,000 home at 4.4% interest).
Click or scroll down to find your area report:
Seattle | Eastside | Mercer Island | Condos | Waterfront
SEATTLE
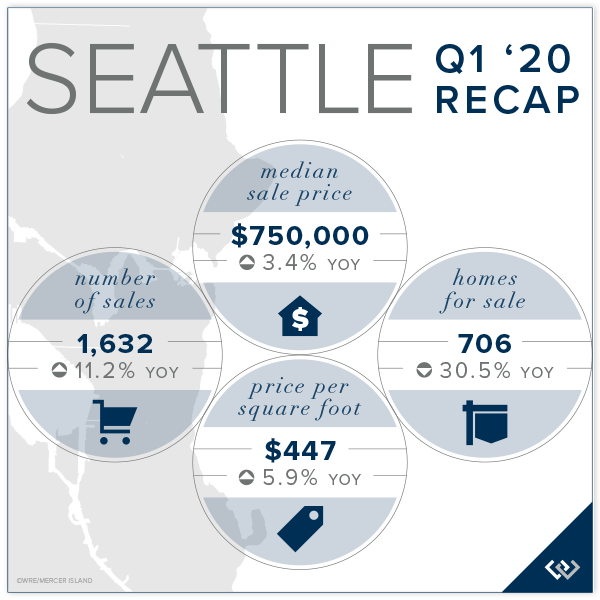
There were 11.2% more Seattle home sales in Q1 2020 (1,632) compared to Q1 2019 (1,468). Seattle’s median sale price increased by an average of 3.4% in 2019 to $750,000. Lake Forest Park (+8.0%) and Queen Anne-Magnolia (+7.0%) were the area’s top performers. The Central Seattle was down 6.9% over Q1 2019, much of which can be attributed to fewer luxury market sales and a higher percentage of smaller homes transacting during that period.
In Q1, 68.0% of Seattle homes (all price points) sold at or above their listed price, while only 13.7% of homes priced above $1 million did so. The average number of days to sell decreased to 41 from 50 in Q1 of the year prior.
The highest Seattle home sale was a 1930-built Lake Forest Park waterfront home for $5,000,000 and the lowest was a 1955-built 2-bedroom Skyway home for $215,000.
Click here to view the complete report for a neighborhood by neighborhood breakdown of Average Sale Price, size, and number of homes sold.
EASTSIDE
In Q1, 64.6% of Eastside homes, and 28.6% of homes priced above one million dollars, sold for at or above their listed price.
The Eastside median sale price was $989,500 in Q1, up 6.8% over Q1 2019. South Eastside (+18.1%) and Kirkland (+14.1%) performed best, while Woodinville saw a 2.5% decrease in its median sale price. The highest sale was an $11.5 million Medina waterfront home and the lowest sale was a 1960’s Lake Margaret area cottage.

Click here for the full report and neighborhood-by-neighborhood statistics!
MERCER ISLAND
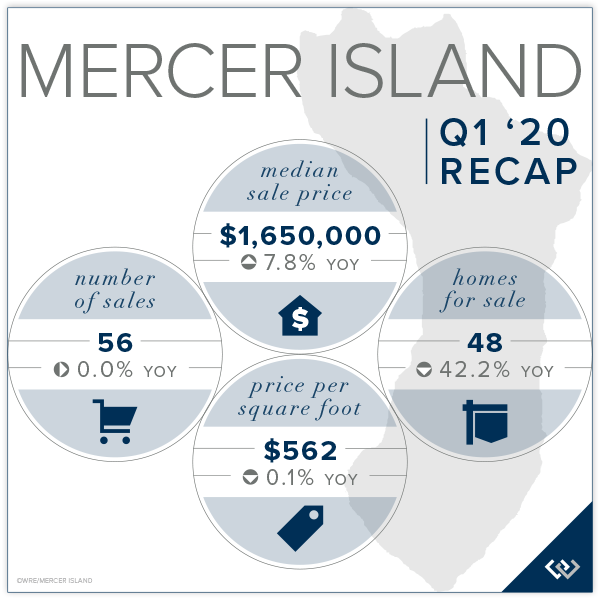
Mercer Island has seen a record shortage of homes on the market in Q1 with the lack of homes for sale dominating conversations between buyers and their brokers. There were 56 home sales in the first quarter, with only 6 homes sold below $1 million and 19 with sale prices above $2 million.
In Q1, 48.2% of all homes, and 12.5% of homes priced above two million dollars, sold for at or above their listed price. The highest Mercer Island sale was a $4.8 million waterfront home on the north-eastern tip of the Island. The lowest was a $815,000 renovation/rebuild ready rambler on West Mercer Way.
Click here to view the complete report for a neighborhood by neighborhood breakdown of Average Sale Price, size, and number of homes sold.
CONDOS – SEATTLE & EASTSIDE
Seattle’s condo median sale price was the same in Q1 2020 as in Q 1 2019 ($460,000) with 605 units transacting. The North Seattle (+28.3%) and Richmond Beach-Shoreline (+18.4%) outperformed the region while West Seattle condos were down 5.0% over Q1 of the prior year. In Q1, 53.7% of Seattle condos (all prices), and 3.1% of condos priced above one million dollars, sold for at or above their listed price.
On the Eastside, the median sale price was up 6.5% to $490,000. Woodinville (+21.4%) and Redmond (+17.2%) condos outpaced those in surrounding cities while East Bellevue condos sold for 23.2% less than in Q1 2019. There were 528 units sold on the Eastside this quarter.
In Q1, 67.4% of all Eastside condos, and 4.2% of those priced above one million dollars, sold for at or above their listed price.
Check out all of these factoids and more in the full condo report.
WATERFRONT
The pace of waterfront transactions has been slowing over the past few quarters, driven in large part by fewer international buyers in the market. Even so, Q1 was markedly off for waterfront sales. The Eastside had 3 private waterfront home sales. Seattle had 8, Mercer Island had 2, and Lake Sammamish had no sales in the first three months on 2020.
The highest private waterfront sale in Q1 was on Lake Washington in Medina at $11.5 million. The most affordable waterfront sale was a $1.5 million Beach Drive West Seattle home with 22 feet of waterfront on Puget Sound. Note this report includes privately-owned, rather than shared, waterfront transactions only.
This top-level overview of the entire Seattle-Eastside private waterfront market, including Mercer Island and Lake Sammamish, provides a glance into the trends occurring in our region over time. Interesting, and certainly insightful, it in no way replaces an in-depth analysis on waterfront value provided by a savvy broker with years of local waterfront experience.
Find a Home | Sell Your Home | Property Research
Neighborhoods | Market Reports | Our Team
We earn the trust and loyalty of our brokers and clients by doing real estate exceptionally well. The leader in our market, we deliver client-focused service in an authentic, collaborative and transparent manner and with the unmatched knowledge and expertise that comes from decades of experience.
2737 77th Ave SE, Mercer Island, WA 98040 | (206) 232-0446 mercerisland@windermere.com
© Copyright 2020, Windermere Real Estate/Mercer Island. Information and statistics derived from Northwest Multiple Listing Service and deemed accurate but not guaranteed.
Annual Seattle-Eastside Real Estate Report: A Look Back at 2019

A strong local employment sector, very low mortgage interest rates, and the most balanced market we’ve seen in two decades each contributed to increased sales velocity in 2019.
While the number of homes for sale increased overall in 2019 as compared to 2018, the higher rate of sales throughout the year resulted in nearly a third fewer homes on the market at year-end in 2019 than at the end of 2018. The inventory of homes available to purchase in 2020 will be a dominating factor in the local real estate market in the coming year.
Click or scroll down to find your area report:
Seattle | Eastside | Mercer Island | Condos | Waterfront
SEATTLE
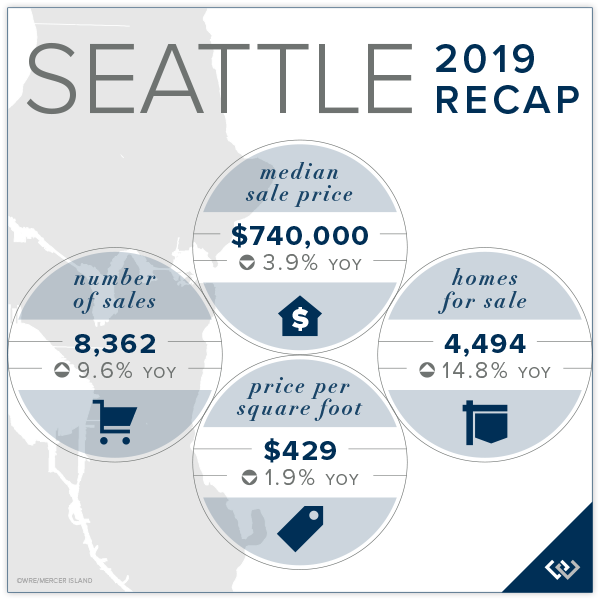
There were 9.6% more Seattle home sales in 2019 (a total of 8,362), bringing Seattle back to its typical annual sales velocity following an off year in 2018. Seattle’s median sale price softened by 3.9% in 2019, with the Central Seattle region performing best (-1.6%) and the Ballard-Green Lake region down the most (-4.6%). In the north end of Seattle, Lake Forest Park-Kenmore and Richmond Beach-Shoreline showed the strongest five-year growth trend at 47.1% and 45.5% respectively.
In 2019, 53.9% of all Seattle homes sold at or above their listed price. The average number of days to sell jumped notably to 36 from 22 the year prior, indicating movement towards a more balanced market. The upper price segments of the market were far less competitive with just 10.4% of homes sold above one million dollars transacting at or above their list price.
The highest Seattle home sale was in Washington Park (Central Seattle) for $13,750,000 and the lowest was a Lake Union houseboat for $80,000.
Click here to view the complete report for a neighborhood by neighborhood breakdown of Average Sale Price, size, and number of homes sold.

EASTSIDE
On the Eastside, neighborhoods central to core employment hubs continue to see older, more affordable housing stock replaced with new and more expensive development. On the periphery, reasonably priced homes are highly competitive as homebuyers and investors alike scramble for homes that offer greater appreciation potential.
Development in East Bellevue, particularly surrounding the Spring District, is predicted to significantly drive prices upward in the coming years as employment centers expand and light rail service to Seattle begins.
In 2019, 49.7% of all homes, and 18.8% of homes priced above one million dollars, sold for at or above their listed price.
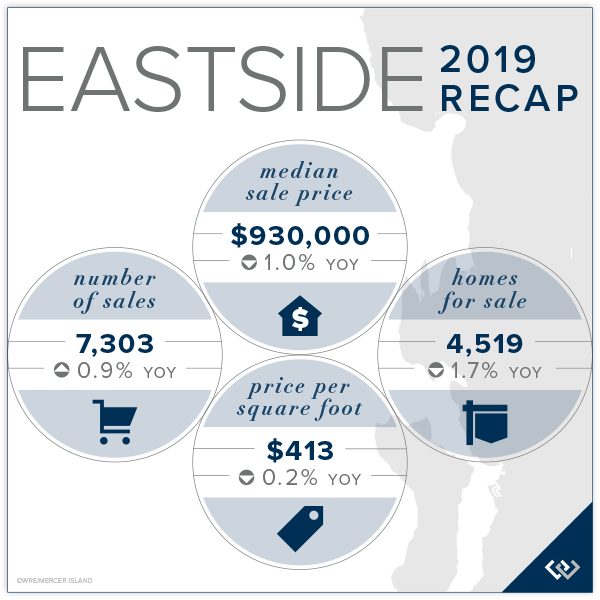
Median sale prices in Eastside cities fared better than those in Seattle, with the overall Eastside median sale price down 1.0% from 2018. Kirkland performed best on the Eastside with a median sale price gain of 3.8% to $1,350,000. Looking at the five-year trend, Kirkland came in on top with a 67.1% increase in its median sale price over the past five years, followed by Juanita-Woodinville-Duvall at 48.0%, and East Bellevue at 44.5%.
Click here for the full report and neighborhood-by-neighborhood statistics!

MERCER ISLAND
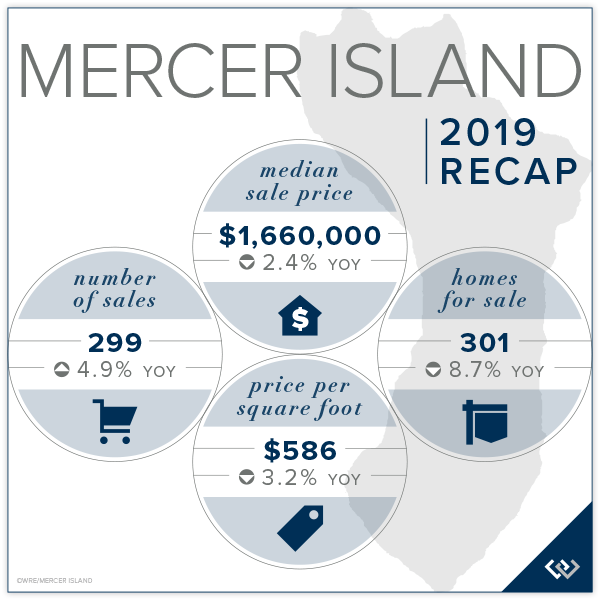
Mercer Island, central to the Seattle-Eastside region, held the middle ground with prices softening slightly—not as much as in Seattle, but more than on the Eastside.
A total of 299 homes changed hands in 2019 according to Northwest Multiple Listing Service. The highest Mercer Island sale was a $10,050,000 waterfront home on the North End. The lowest was a $685,000 renovation/rebuild ready rambler on West Mercer Way.
In 2019, 39.8% of all homes, and 12.7% of homes priced above two million dollars, sold for at or above their listed price.
Well-priced homes in move-in ready condition, with good lighting and access, and with functional floor plans, command the most attention from market-savvy buyers hoping to make a good investment in the place they will call home.
Click here to view the complete report for a neighborhood by neighborhood breakdown of Average Sale Price, size, and number of homes sold.

CONDOS – SEATTLE & EASTSIDE
The Seattle and Eastside condo markets could not be more different. Seattle has seen the number of available units increase significantly while the Eastside has suffered from a lack of inventory.
Seattle’s overall condo median sale price declined by 9.3% in 2019 to $458,500. The Ballard-Green Lake market was down the most (-16.4%) while Lake Forest Park-Kenmore was the only market not in the red (up 3.3%). In 2019, 45.9% of all Seattle condos, and 2.9% of condos priced above one million dollars, sold for at or above their listed price.
On the Eastside, the median sale price was down 2.4% overall to $469,000. The communities south of I-90 did quite well with a 9.0% increase over 2018. Redmond fared worst with a 15.3% decline in its median sale price. In 2019, 49.3% of all Eastside condos, and 2.7% of condos priced above one million dollars, sold for at or above their listed price.
Check out all of these factoids and more in the full condo report.

WATERFRONT
The Eastside had 42 private waterfront home sales in 2019. Seattle had 41, Mercer Island had 20, and Lake Sammamish had 31 sales during the same period.
The highest Eastside—and regional—private waterfront sale of 2019 was on Hunts Point for $37,500,000. The highest 2019 sales in the surrounding areas include a Washington Park (Seattle) home at $13,750.000, a north end Mercer Island property at $10,050,000, and a $5,750,000 home on the west side of Lake Sammamish.
This top-level overview of the entire Seattle-Eastside private waterfront market, including Mercer Island and Lake Sammamish, provides a glance into the trends occurring in our region over time. Interesting, and certainly insightful, it in no way replaces an in-depth analysis on waterfront value provided by a savvy broker with years of local waterfront experience.

ABOUT WINDERMERE MERCER ISLAND
We earn the trust and loyalty of our brokers and clients by doing real estate exceptionally well. The leader in our market, we deliver client-focused service in an authentic, collaborative and transparent manner and with the unmatched knowledge and expertise that comes from decades of experience.

© Copyright 2020, Windermere Real Estate/Mercer Island. Information and statistics derived from Northwest Multiple Listing Service and deemed accurate but not guaranteed.
2019 Holiday Happenings in the Seattle Area

Our Northwest holidays may be wet, but they’re still bright! Make the most of the season with Seattle favorites—such as dazzling light displays and the Parade of Boats—along with newer additions like the “Enchant” event with light mazes and ice skating inside T Mobile Park. Scroll down for all the details…
WildLights at Woodland Park Zoo
West Entrance: 5500 Phinney Ave. N, Seattle, WA 98103
South Entrance: 750 N 50th St, Seattle, WA 98103
www.zoo.org/zoolights
click here to get tickets
- Dates/Times: Open nightly 11/29/19 – 1/5/20 | 5:30 – 8:30 pm
- Cost: $10.95 – $16.95 per person (ages 2 and under are free)
- Promotions: Get a 10% group discount on WildLights tickets for groups of 20+. Zoo members get 20% off adult tickets.
- Parking: Free parking is available at all lots after 4:30 pm (admission at both gates)
- Food: Refreshments are available at the pizza trailer on the North Meadow, and at Gather and Graze (with covered seating provided). You are also welcome to bring your own food and non-alcoholic beverages.
- Special activities: Carousel, fire pits, select indoor animal exhibits, ZooStore, & indoor snowball fights at the Snowmazium
- Closures: December 2, 3, 9, 10, 24 & 25, 2019
Image courtesy of https://zoo.org/zoolights
Winterfest at Seattle Center
305 Harrison Street, Seattle, WA 98109
www.seattlecenter.com/winterfest
Map
- Dates/Times: Winter train & village open daily 11/29/19 – 12/31/19 | 10 am – 6 pm
Winterfest Ice Rink open 11/29/19 – 1/5/20, Sun-Thu from 11 am – 8 pm, Fri-Sat from 11 am – 10 pm, New Year’s Eve Celebration 12/31/19 from 8pm to midnight
- Cost: Free for all ages (ice skating is $2 – $8 including rental)
- Parking: Paid parking available at the Mercer Garage, 5th Ave N Garage, and Theatre Commons Lot. Click here for the campus map
- Food: A multitude of dining options await you in the Armory
- Special events: Ice skating at the Winterfest Ice Rink, ice sculpting, caroling, the Winter Train & Village, New Year’s Eve Celebration and more!
- Holiday Closure: 12/25
Enchant at T-Mobile Park
1250 1st Ave S, Seattle, WA 98134
https://enchantchristmas.com/seattle/
click here to get tickets
- Dates/Times: 11/22/19 – 12/29/19 | 4pm to 11pm Fri-Sun, 4pm to 10pm weekdays until 12/12, then 4pm to 11pm every day 12/13-19 – 12/29/19
- Cost: $19.99 – $32.99 per person (ages 3 and under are free) | VIP passes with dinner starting at $74.99 for adults
- Promotions: Discount on final 2 hours of any day | 20% off with a 4-ticket family pack
- Parking: $8 – $60 at Safeco Field Garages or check out the city’s Interactive Parking Map
- Food: Seasonal food and treat concessions throughout
- Activities: Ice skating trail, light maze, visits with Santa, gift market
- Closures: 11/25/19 – 11/28/29, 12/2/19

Image courtesy of enchantchristmas.com
Garden d’Lights at Bellevue Botanical Garden
12001 Main Street, Bellevue WA 98005
http://gardendlights.org
click here to get tickets
- Dates/Times: Open nightly 11/30/19 – 12/31/19 | 4:30 – 9:00 pm
- Cost: $5 per person (ages 10 and under are free)
- Parking: Premium parking is $5 per car in the Garden’s lot (cash only) as space allows OR park for free at Wilburton Hill Park
- Food: Hot drinks and snacks are available at the Aaron Education Center
- Activities: Gingerbread village, live music
- Holiday Closures: None

Photo courtesy of gardendlights.org
Snowflake Lane at the Bellevue Collection
Bellevue Way & NE 8th Street, Bellevue WA 98004
http://snowflakelane.com/
- Dates/Times: Nightly 11/29/19 – 12/24/19 | 20 minute show starts at 7 pm
- Cost: Free for all ages
- Parking: Free parking at Bellevue Square, Bellevue Place and Lincoln Square
- Food: A variety of dining options (from happy hour, to kid fare, to gourmet meal) are all within walking distance
- Special Events & Activities: Ice Skating, Santa Parade & Tree Lighting, Santa Photos
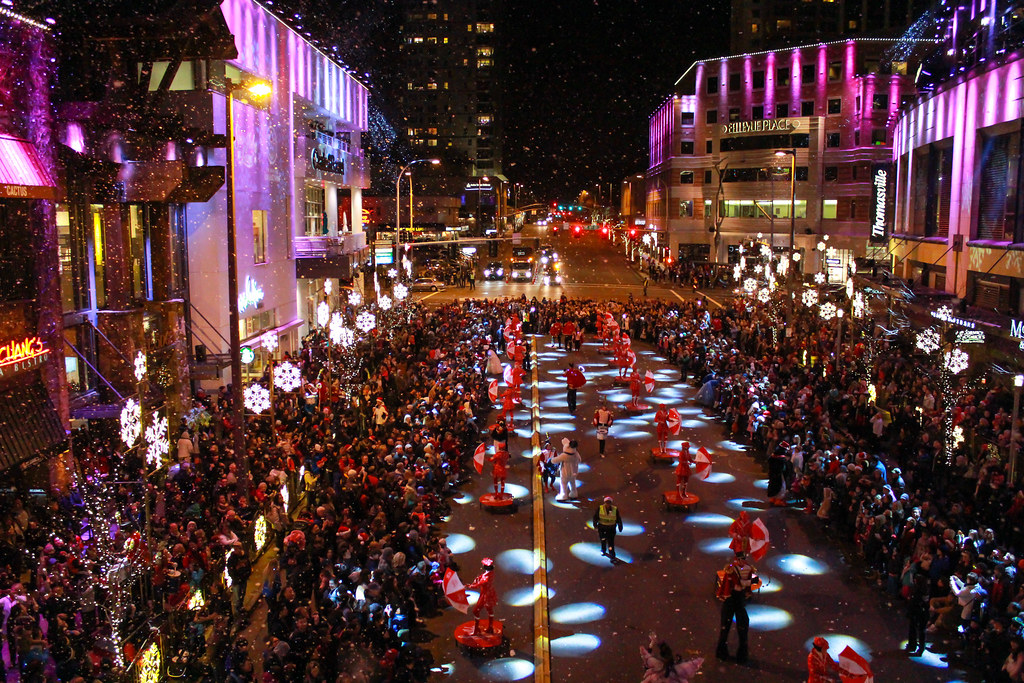
Image courtesy of http://bellevue.com/snowflake-lane
Christmas Ship Festival
Launch locations include Lake Union Park, Kirkland City Dock, Hyatt Regency Lake Washington, Des Moines Marina, Port of Poulsbo, Seattle Waterfront – Pier 55, Tacoma (Dock Street Marina), Edmonds, and Shilshole Bay Marina
www.argosycruises.com
click here to get tickets
- Dates/Times: Click here for the full schedule
- Cost: $29 – $68 per person (kids 3 and under are free)
- Parking: Varies by location – click here for details
- Food: While dining ahead of time is recommended, there are snacks and drinks available for purchase on the ship. You can also pre-order FaresStart Catering boxed meals, snacks and Ivar’s clam chowder (with vegetarian and gluten-free options) at least 72 hours prior to your cruise. Outside food/drinks are not allowed.
- Special Events: Parade of Boats Night, Kid Cruise, Grand Finale Night

Ivar’s Clam Lights at Gene Coulon Memorial Beach Park
1201 Lake Washington Blvd N, Renton, WA 98056
https://rentonwa.gov/clamlights
- Dates/Times: Open nightly 12/6/19 – 1/1/20 | 5 – 9 pm
- Cost: Free for all ages
- Parking: Park for free at the Gene Coulon Memorial Beach Park parking lot
- Kickoff Event on Friday, December 6th at 5:30pm: Official lighting ceremony, photo op with Santa & Mrs. Claus in their sleigh, and more!
- Holiday Closures: None

Image courtesy of https://rentonwa.gov/clamlights
Westlake Center Tree Lighting & Holiday Activities
400 Pine St., Seattle, WA 98101 (Westlake Park)
https://redtri.com/guides/downtown-seattle-heart-of-the-holidays-seattle-wa-hg2019/
- Dates/Times: Tree lighting ceremony (with snow and fireworks) on 11/29/19, time TBD. Holiday market Fri-Sun beginning 11/29 through 12/22. Carousel and other festive attractions run 11/29 through January 1st, 2020
- Cost: Free for all ages
- Parking: Access the Republic Parking garage from Olive Way between 4th & 5th Ave, or check out this interactive map of city parking
- Activities: Carousel, Holiday Market at Westlake Park
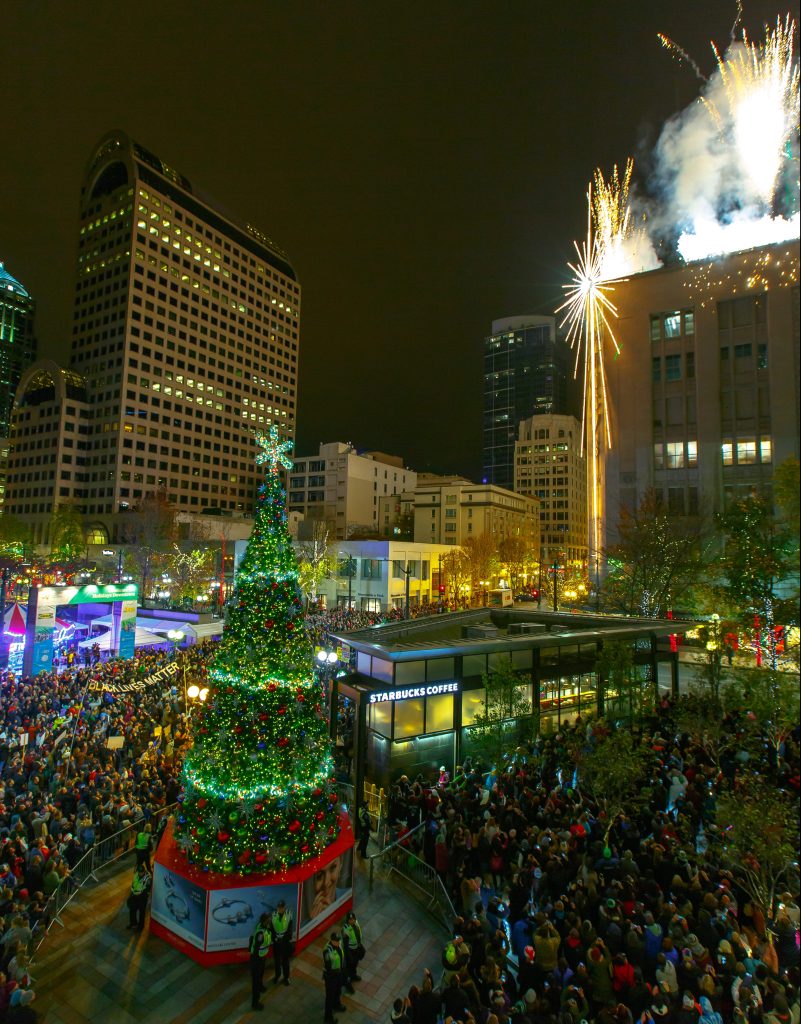
Image courtesy of http://redtri.com
Zoolights at Point Defiance Zoo & Aquarium
5400 N Pearl St, Tacoma, WA 98407
www.pdza.org/event/zoolights
click here to get tickets
- Dates/Times: Open nightly 11/29/2019 – 1/5/2020 | 5 – 9 pm
- Cost: $11-$13 (free for kids 2 & under)
- Promotions: Discounted tickets for zoo members; Military discount nights Dec. 2, 4, 9, 11, 14 & 18
- Parking: Free parking in zoo lots (carpooling recommended)
- Food: Make your own s’mores at the cafe deck firepits, or grab hot cocoa, dinner, snacks & 21+ beverages from the Plaza Cafe, Pearl St Grille & food stands
- Activities: Carousel, aquarium, Kids’ Zone with meerkats & goat feeding
- Holiday Closure: 12/24
Image courtesy of https://www.pdza.org
But wait, there’s more…
Holiday theatrical & musical shows
The Polar Express train ride at Mt. Rainier Railroad
Gingerbread Village at the Sheraton Grand Seattle
Leavenworth Lighting Festival & Snow Bus Tour
ABOUT WINDERMERE MERCER ISLAND
We earn the trust and loyalty of our brokers and clients by doing real estate exceptionally well. The leader in our market, we deliver client-focused service in an authentic, collaborative and transparent manner and with the unmatched knowledge and expertise that comes from decades of experience.
© Copyright 2019, Windermere Real Estate/Mercer Island.
Q3 2019 Reports: Market Update

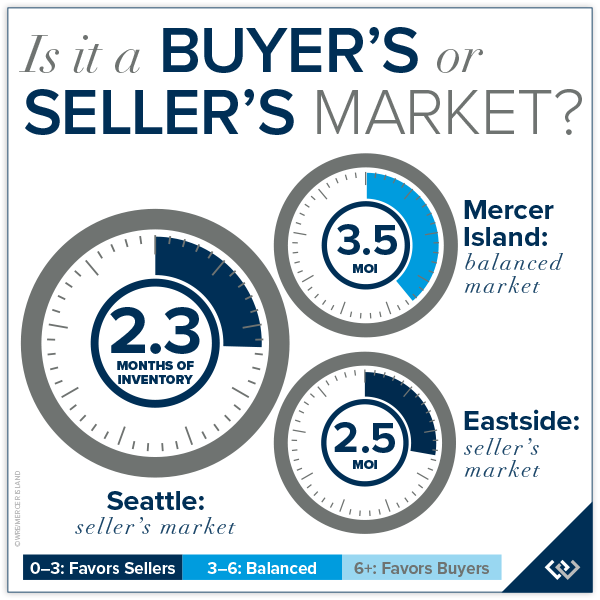
Q3 was the most stable and balanced market we have seen in years. With very low mortgage interest rates compelling buyers to act and fewer homes for sale than we saw last fall (when a flood of homes came to market), buyers and sellers are each finding their own place in a more equitable real estate arena.
Approximately 41% of homes for sale in Q3 sold at or above their listed price. This segment was on the market for an average of just seven days and included the most highly desired and well-priced properties in mainstream price points. Of the remaining homes for sale, just over one third underwent a price reduction before resulting in a sale. That number increased steadily as we moved deeper into Q3, ending the quarter with an average of 43% of listed homes with sales occurring following a price reduction.
From a home buyer’s perspective, the best properties sold quickly and at a premium. Of the homes that remained on the market, there was ample room for negotiation to a fair price. Q3 home sellers were generally more informed and more likely to price realistically from the start and adjust quickly if they were off target.
This more balanced market afforded many more consumers the ability to comfortably complete a sell/buy transaction and with enough time and space to thoroughly conduct due diligence on prospective properties.
Click or scroll down to find your area report:
Seattle | Eastside | Mercer Island | Condos | Waterfront
SEATTLE
The Seattle in-city real estate market slowed from a racetrack inferno to cruising speed over the past year and a half. Prices softened an average of 2% in Q3 with the Central Seattle region feeling the biggest impact (down 7.6% from Q3 2018). The Ballard-Green Lake region had the highest number of Q3 sales (582) while the Lake Forest Park-Kenmore area boasted the most affordable cost per home square foot ($340). When it comes to returns, Lake Forest Park-Kenmore, South Seattle, and Richmond Beach-Shoreline were nearly tied for the strongest five-year growth trend at 73.9%, 73.3% and 73.2% respectively.

Click here to view the complete report for a neighborhood by neighborhood breakdown of Average Sale Price, size, and number of homes sold.

EASTSIDE
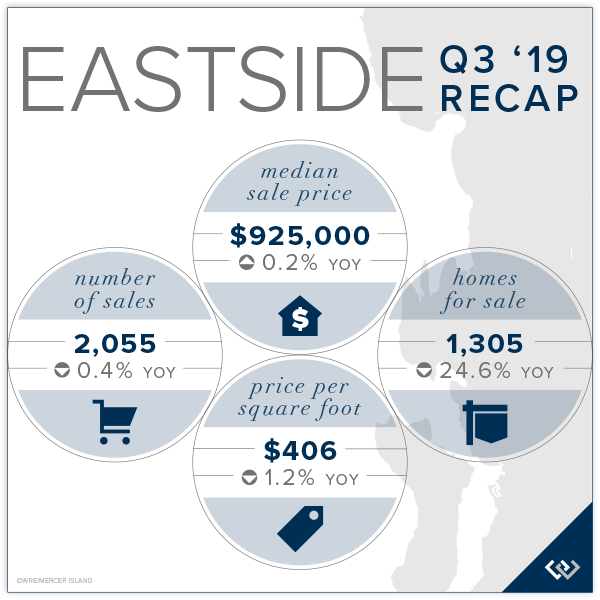
Stimulated by announced expansion from the top names in tech, the Eastside is the place to be right now. Buyers found far fewer homes for sale—nearly 25% less—in Q3 than they did just one year ago. Sale prices in Kirkland, bolstered by recent announcements from Google and Tableau, were up an average of 15.4% over Q3 2018. Prices near the Microsoft campus, where the Spring District is coming online, where up 3.2%. The West Bellevue market saw a lower Median Sale Price which was attributable to fewer high-end sales in Q3 this year compared to last year. All in all, the Eastside had a very good quarter. Home sellers should be pleased with their returns and home buyers should feel good about purchasing in a robust market.
Click here for the full report and neighborhood-by-neighborhood statistics!

MERCER ISLAND
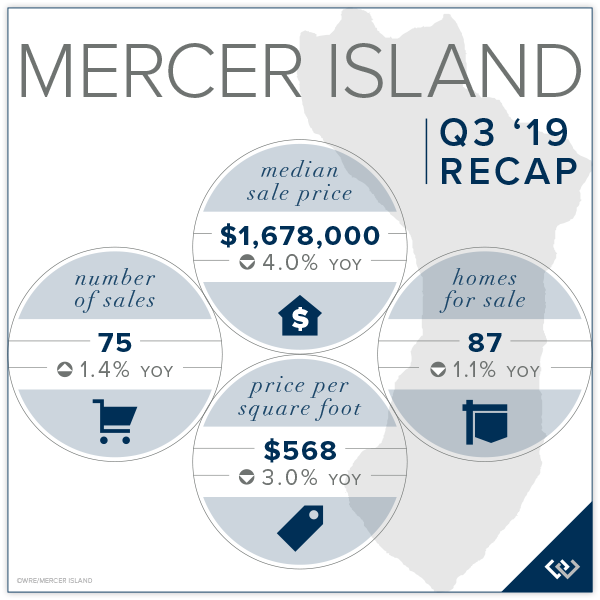
Mercer Island experienced continued slowing in the luxury market with fewer waterfront sales (5) than typical in Q3. Conversely, many moderately-priced renovation-ready homes transacted this quarter bringing the overall Q3 Median Sale Price down 4% to $1,678,000. The Island is finally beginning to see a moderate number of building and remodel applications submitted after a two-year lull sparked by major changes in the city’s residential building code. The North End had the highest average cost per square foot ($620) while Mercerdale ($435) was most affordable. First Hill had the shortest average market time with just 5 days and East Mercer had the longest (117 days). Demand remains steady and we expect well-priced, turnkey condition homes to continue to do quite well as we move further into the fall market.
Click here to view the complete report for a neighborhood by neighborhood breakdown of Average Sale Price, size, and number of homes sold.

CONDOS – SEATTLE & EASTSIDE
Competition from new and pre-sale buildings, aging structures, a larger percentage of affordable units transacting, and urban flight have contributed to the 12.3% Median Sale Price decline in Seattle to $438,500 (from $500,000 in Q3 2018). To be fair, the Five-Year Median Price Trend shows prices up 71.9% since Q3 2014, giving most condo owners a nice cushion to fall back on.
The Median Sale Price was down 1.9% on the Eastside to $471,000 from $480,000. An extremely low number of resale units for sale, coupled with many of the same attributes impacting the Seattle condo market, contributed to the slight softening seen in the Eastside condo market.
Recent changes in Washington condo laws will eventually bring more condos and townhomes online in the next economic cycle, but potential buyers may have to wait 5-7 years to see that morph from concept to reality.
Check out all of these factoids and more in the full condo report.

WATERFRONT
Seattle had 13 private waterfront home sales in Q3, the highest of which was a $10.6 million Laurelhurst estate on a shy acre with 150 feet on the water. The Eastside (Bellevue-Kirkland) had nine sales in Q3, including a $15.4 million 1925-built Yarrow Point home on 1.15 acres with 100 feet along the water’s edge. Further east, Lake Sammamish had eleven waterfront sales in Q3 ranging from $2.0-4.5 million.
Centrally located to the Seattle-Bellevue metro areas, Mercer Island had five private waterfront sales ranging from a $10.1 million, 2002-built North End home with 124 feet of waterfront on one and a half acres to a $3.6 million, mid-century Eastside home with 85 feet on the water and just over half an acre.
This top-level overview of the entire Seattle-Eastside private waterfront market, including Mercer Island and Lake Sammamish, provides a glance into the trends occurring in our region over time. Interesting, and certainly insightful, it in no way replaces an in-depth analysis on waterfront value provided by a savvy broker with years of local waterfront experience.

ABOUT WINDERMERE MERCER ISLAND
We earn the trust and loyalty of our brokers and clients by doing real estate exceptionally well. The leader in our market, we deliver client-focused service in an authentic, collaborative and transparent manner and with the unmatched knowledge and expertise that comes from decades of experience.
© Copyright 2019, Windermere Real Estate/Mercer Island. Information and statistics derived from Northwest Multiple Listing Service and deemed accurate but not guaranteed.
Kicks for Kids Shoe Drive Now Through August 15th

WHAT: Windermere’s Kicks for Kids event is a back-to-school sneaker drive for low-income youth, distributed through the Eastside Baby Corner.
WHY: Kids from struggling families are in need of back-to-school shoes that fit. When kids feel good about their appearance, it improves both their self-esteem and their performance in school.
WHEN: Formal shoe collection will take place through August 15, 2019.
WHERE: Windermere Mercer Island is the collection point where you can drop off new athletic shoes or sneakers (youth sizes 1-6 and adult sizes 7-9) or a gift card.
WHO: Sponsored by Windermere Mercer Island in partnership with the Eastside Baby Corner, located in Issaquah, Washington.
Windermere Mercer Island invites you to help in its back-to-school sneaker drive, known as the Kicks for Kids Shoe Drive, which serves the local communities to connect low-income youth with shoes for the upcoming school year. This year, we’re connecting once again with the Eastside Baby Corner, which is an amazing organization that helps kids thrive by providing resources and essentials with their 51 partner agencies – 26 of which are access to services through schools. The Eastside Baby Corner partners with charitable organizations throughout the Greater Seattle Area and helps them with the resources they need to best assist local families in need. Click here to go above and beyond the shoes with their back-to-school wish list!
Help us make sure every child has a new pair of shoes for school!

ABOUT WINDERMERE MERCER ISLAND
We earn the trust and loyalty of our brokers and clients by doing real estate exceptionally well. The leader in our market, we deliver client-focused service in an authentic, collaborative and transparent manner and with the unmatched knowledge and expertise that comes from decades of experience.
© Copyright 2019, Windermere Real Estate/Mercer Island
Q2 2019 Reports: Market Update
Changes in the home lending environment drove down mortgage interest rates in Q2 to their lowest levels in years, giving buyers more buying power for their money and stimulating demand for available homes on the market.
The number of homes for sale is up markedly, especially in Seattle, as is the number of closed sales, with low interest rates and high local incomes taking much of the credit for the market activity. Sale prices have remained modest as buyers feel more cautious about overpaying for a home at or near the cyclical market peak.
As stated in earlier reports, the market has much to offer buyers and sellers this year. We believe those looking to make a move in the next few years should do so this year when they can still secure incredibly affordable mortgage financing. Today’s buyers should be prepared to stay in their home at least five years. Home sellers moving to lower cost regions may also benefit from selling now. We know that every situation is unique, and we are here to help you evaluate your personal real estate holdings and purchase strategy.
Click or scroll down to find your area report:
Seattle | Eastside | Mercer Island | Condos | Waterfront
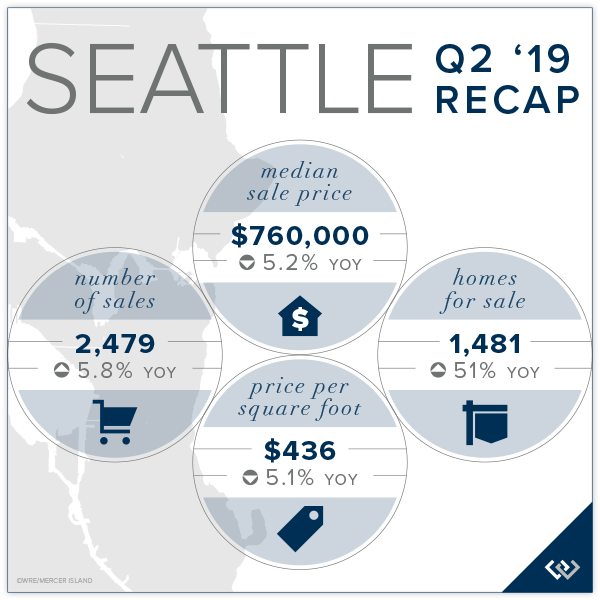
SEATTLE
The number of homes for sale continued to rise across Seattle. West Seattle and Richmond Beach/Shoreline experienced the greatest velocity in number of sales. Seattle’s overall Median Sale Price was up 4.8% from Q1 to $760,000, but down 5.2% from Q2 2018. The Average $ Per Square Foot was down 5.1% from Q2 last year to $436. North Seattle, Queen Anne/Magnolia and West Seattle all performed better than the average in Q2. Seattle homeowners have seen a 61% increase in the Median Sale Price over the past five years.
Click here to view the complete report for a neighborhood by neighborhood breakdown of Average Sale Price, size, and number of homes sold.

EASTSIDE
The Eastside cities of Bellevue, Kirkland, and Redmond have become the epicenter of tech growth planned over the next few years. Recent announcements from Amazon, Google, Facebook, and Microsoft, coupled with light rail coming in 2023, have made the Eastside the place to be. The Eastside’s Median Sale Price was up 1.9% from Q1 to $945,000, but down 1.6% from Q2 2018’s peak of $960,305. The five-year Eastside median price trend is up 53% since 2014.
Mercer Island rebounded in Q2 from a poorly performing Q1 while Kirkland and South Eastside fared better than average. A total of 2,334 Eastside home sales closed in Q2, up 1.2% from Q2 2018.

Click here for the full report and neighborhood-by-neighborhood statistics!

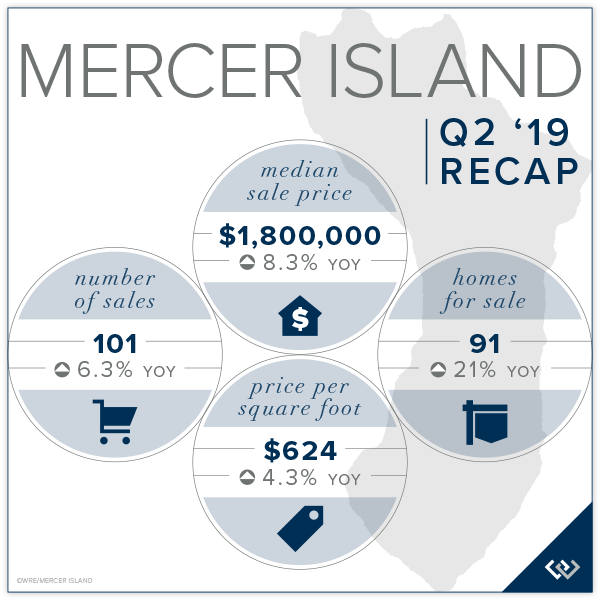
MERCER ISLAND
Mercer Island’s Median Sale Price rallied back up in Q2 to $1.8 million after lower than typical sales drove it down to $1.53 in Q1. Eight waterfront sales contributed to the overall increase, as did the total sales velocity of 101 homes sold in Q2—the highest number of sales than in any of the preceding eight quarters.
Click here to view the complete report for a neighborhood by neighborhood breakdown of Average Sale Price, size, and number of homes sold.

CONDOS – SEATTLE & EASTSIDE
Seattle’s condo Median Sale Price was up 5.1% from Q1 to $483,500, but down 7.9% from a peak of $525,000 in Q2 of 2018. The Average $ Per Square Foot was $580. Condos in West Seattle and Lake Forest Park/Kenmore performed best in Q2.
The Eastside’s condo Median Sale Price was up 4.3% from Q1 to $480,000, but down 2.1% from the $490,500 median of Q2 2018. The Average $ Per Square Foot was $453. West Bellevue and Kirkland Condos performed well above condos in other Eastside markets.
Check out all of these factoids and more in the full condo report.

WATERFRONT
A significant number of private waterfront homes transacted in Q2 2019—fourteen on the Eastside, eight on Mercer Island, and eleven each in Seattle and Lake Sammamish. The highest Q2 sale was a 1998 Yarrow Point home on 115 feet of waterfront sold at $14,250,000 after 22 days on the market. The lowest sale was a 1945 Kennydale area home on 53 feet of Lake Washington waterfront for $1,075,000 on the market for 64 days.
The Eastside and Lake Sammamish both had a very moderate supply of inventory in relation to the number of sales that occurred. Seattle and Mercer Island still had more homes on the market than recent demand has dictated, although the volume of sales in Q2 improved the oversupply of inventory, heating up these markets to their highest levels in some time.
This top-level overview of the entire Seattle-Eastside private waterfront market, including Mercer Island and Lake Sammamish, provides a glance into the trends occurring in our region over time. Interesting, and certainly insightful, it in no way replaces an in-depth analysis on waterfront value provided by a savvy broker with years of local waterfront experience.

ABOUT WINDERMERE MERCER ISLAND
We earn the trust and loyalty of our brokers and clients by doing real estate exceptionally well. The leader in our market, we deliver client-focused service in an authentic, collaborative and transparent manner and with the unmatched knowledge and expertise that comes from decades of experience.
© Copyright 2019, Windermere Real Estate/Mercer Island. Information and statistics derived from Northwest Multiple Listing Service and deemed accurate but not guaranteed.
Q1 2019 Reports: How’s the Market?
Be forewarned, this quarter’s report looks somewhat dismal. There are two very relevant facts that should be taken into consideration when reviewing it. The first is that Q1 is nearly always the worst performing quarter of any year because the sales completed in Q1 typically went under contract between late November and the end of February—a notably quieter time of year in our seasonal Seattle market.
The second aspect to consider is that Q1 of 2018 was an atypically strong quarter and likely marked the peak of the current real estate cycle as buyers approach this year’s spring market with cautious optimism rather than the reckless abandon that we witnessed in the first four months of last year.
Since then, mortgage interest rates rose in November to a seven-year high of 4.87% and then subsequently came down to 4.27% in March—creating enough of a stir to get buyers attention. Each 1% increase in mortgage interest rate is equivalent to a 10% increase in home price. Conversely, a half point drop in the rate is comparable to a 5% price reduction.
Sellers and buyers are beginning the second quarter on more equal footing than they’ve had since the late 1990’s as we’ve rapidly oscillated between a seller’s market, a buyer’s market, and then a seller’s market again with little breathing room in between. Sellers have enjoyed a seven-year run with double digit annual appreciation most of those years. Buyers have enjoyed record setting low interest rates and can purchase today at what amounts to roughly 60% of the monthly expense of the forty-seven-year average 8.09% mortgage interest rate.
The market has much to offer buyers and sellers this year. We believe those looking to make a move in the next few years should do so this year when they can still secure incredibly affordable mortgage financing. Today’s buyers should be prepared to stay in their home at least five years. Home sellers moving to lower cost regions may also benefit from selling now. We know that every situation is unique, and we are here to help you evaluate your personal real estate holdings and purchase strategy.
Click or scroll down to find your area report:
Seattle | Eastside | Mercer Island | Condos | Waterfront
SEATTLE
The number of homes for sale more than doubled in Q1 compared to one year ago giving buyers options and compelling sellers to put their best foot forward. Seattle’s overall Median Sale Price was down 5.8% from Q1 2018 to $725,000 and down 1.4% from Q4. The Average $ Per Square Foot was down 1.6% from Q1 last year to $422. Queen Anne-Magnolia and North Seattle were the most impacted markets with the largest decrease in median price. As disappointing as the numbers are, Seattle homeowners have seen a 60% increase in the Median Sale Price over the past five years.
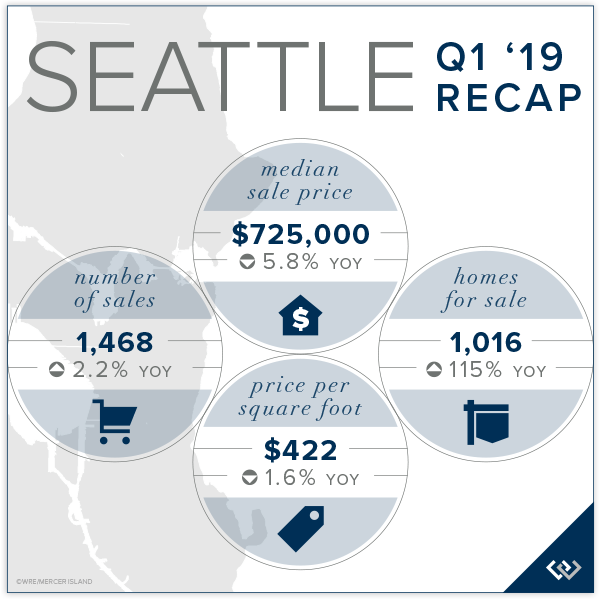
Click here to view the complete report for a neighborhood by neighborhood breakdown of Average Sale Price, size, and number of homes sold.

EASTSIDE
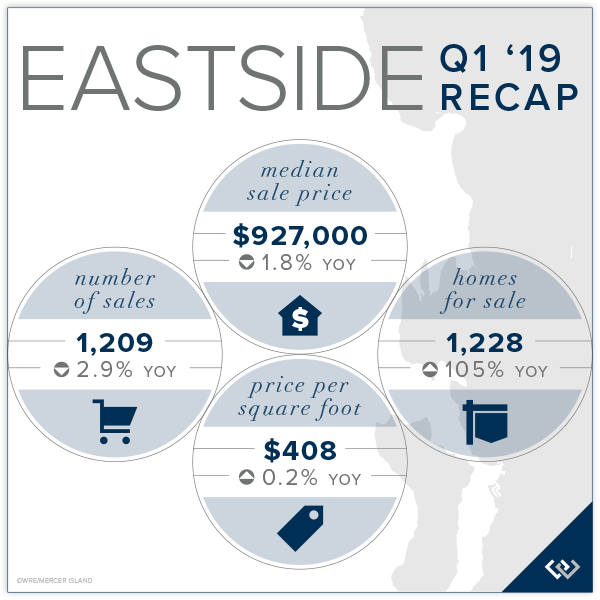
Continued employment growth and planned expansion on the Eastside have benefitted homeowners as compared to Seattle as Bellevue, Redmond and Kirkland prepare for unprecedented development in the next decade. The Eastside’s Median Sale Price was down 1.8% from Q1 2018 to $927,000, but up 3.9% from Q4. The five-year Eastside median price trend is up 53% over 2014.
East Bellevue, East of Lake Sammamish, and Woodinville performed best in Q1—all with median price increases rather than reductions. A total of 1,209 home sales closed in Q1, which was down significantly from Q4, but down only slightly from the robust Q1 2018.
Click here for the full report and neighborhood-by-neighborhood statistics!

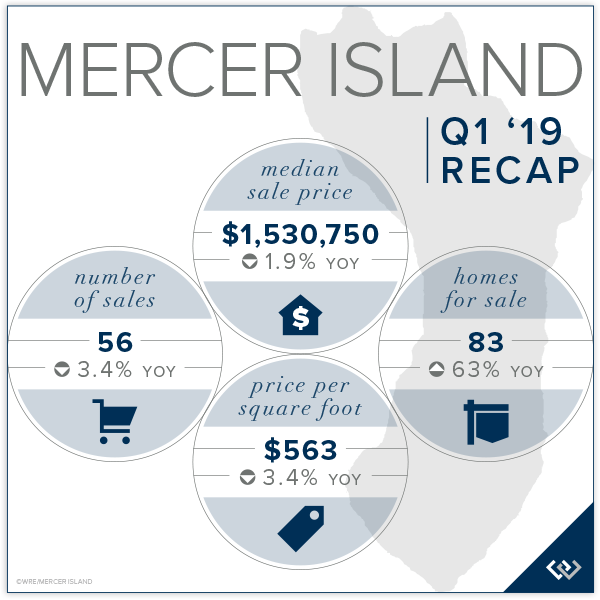
MERCER ISLAND
Following a 10% Median Sale Price increase in 2018, the Mercer Island median fell 1.9% in Q1 2019 from Q1 2018 and 10.9% from Q4. Fewer luxury sales—only one waterfront sold in Q1—and lower demand contributed to the off quarter. The lower velocity of luxury sales impacted the Average Sale Price even more so than Realistically priced homes in solid condition and with desirable lot amenities and settings will do well in Q2 as they are met with demand from the greatest segment of buyers.
Click here to view the complete report for a neighborhood by neighborhood breakdown of Average Sale Price, size, and number of homes sold.

CONDOS – SEATTLE & EASTSIDE
Affordability and access to transportation and amenities continues to drive condo desirability, but a nearly three-fold increase in the number of units for sale and softening apartment rents have tempered demand in some areas.
Seattle’s Condo Median Sale Price was down 4% from Q4 and 10.7% from Q1 2018 to $460,000 following a 12.8% median price increase in 2018. The Average $ Per Square Foot was $577. West Seattle and Queen Anne condos fared better than average while condos prices to the north softened a bit more.
The Eastside’s Condo Median Sale Price was down 5.5% from Q4 and 4.2% from Q1 2018 to $460,000—the same as Seattle—following a 17.2% median price increase in 2018 and a 20.6% increase in 2017. The Average $ Per Square Foot was $431. South Eastside and Mercer Island condos performed better than average while Kirkland condos struggled in Q1.
Check out all of these factoids and more in the full condo report.

WATERFRONT
The Eastside had more private waterfront activity than Seattle, Mercer Island & Lake Sammamish combined. Seattle and Mercer Island sales were far slower than typical in Q1 with only two sales in Seattle and one sale on Mercer Island reported to NWMLS. Mercer Island had eight Q1 sales in 2017 and five in 2018. Seattle had six Q1 sales in 2017 and 3 in 2018.
The highest Q1 sale was a 1963 Yarrow Point home on 80 feet of waterfront sold at $8,650,000 after only 5 days on the market. The lowest sale was a 1940 Pleasure Point bungalow in South Bellevue with 45 feet of waterfront for $1,560,000 on the market for 7 days. Waterfront homes sold in Q1 tended to either sell immediately or languish on the market for months with very few finding middle ground.
This top-level overview of the entire Seattle-Eastside private waterfront market, including Mercer Island and Lake Sammamish, provides a glance into the trends occurring in our region over time. Interesting, and certainly insightful, it in no way replaces an in-depth analysis on waterfront value provided by a savvy broker with years of local waterfront experience.
Check out the full Waterfront Report for a complete list of waterfront home sales by address and community.

ABOUT WINDERMERE MERCER ISLAND
We earn the trust and loyalty of our brokers and clients by doing real estate exceptionally well. The leader in our market, we deliver client-focused service in an authentic, collaborative and transparent manner and with the unmatched knowledge and expertise that comes from decades of experience.
© Copyright 2019, Windermere Real Estate/Mercer Island. Information and statistics derived from Northwest Multiple Listing Service and deemed accurate but not guaranteed.
Annual Seattle-Eastside Real Estate Report: A Look Back at 2018

An increase in homes for sale coupled with rising interest rates have created a far more balanced market than we started 2018 with. This is a good thing as it will help our region tame affordability and create a sustainable marketplace. More homes came to market in 2018 than in any year since 2011. This provided home buyers with plentiful choices and forced home sellers to competitively position their homes to compete with other homes for sale—something they haven’t had to give much thought to in the last seven years.
The cost of a 30-year fixed-rate mortgage began the year at 3.95% and ended at 4.64%. Indications show rates could rise to 6% by the end of 2019. Mortgage rates are a far bigger factor than most people consider. A 1% increase in mortgage interest rates decreases buying power by 10%. Or said differently, a 1% rate increase has the same net effect on monthly payment as a 10% increase in the sale price. That also means if prices fell 10% but rates went up 1% the monthly mortgage payment would remain the same.
Our 2019 market will be driven by buyers motivated to beat interest rate hikes nipping at their heels and by sellers who will choose to price moderately following a seven-year appreciation growth run. Properly-priced homes in good condition and in desirable settings will do well, as will affordable homes on the periphery of the metro region. Strategic positioning, savvy marketing, and expert negotiation have never been so important as they are now.
Click or scroll down to find your area report:
Seattle | Eastside | Mercer Island | Condos | Waterfront
SEATTLE
2018 was a year of transition from an ultra-competitive seller’s market to a more balanced market. The first four months of the year saw dramatic price acceleration—arguably far beyond the comfort of Seattle area home buyers—as home values skyrocketed each month through the spring market. Around the beginning of May, home buying activity slowed as the number of homes for sale increased and buyers had more choices for the first time in years. Home prices have declined since that peak in most neighborhoods, but still ended the year up comfortably over 2017 values.
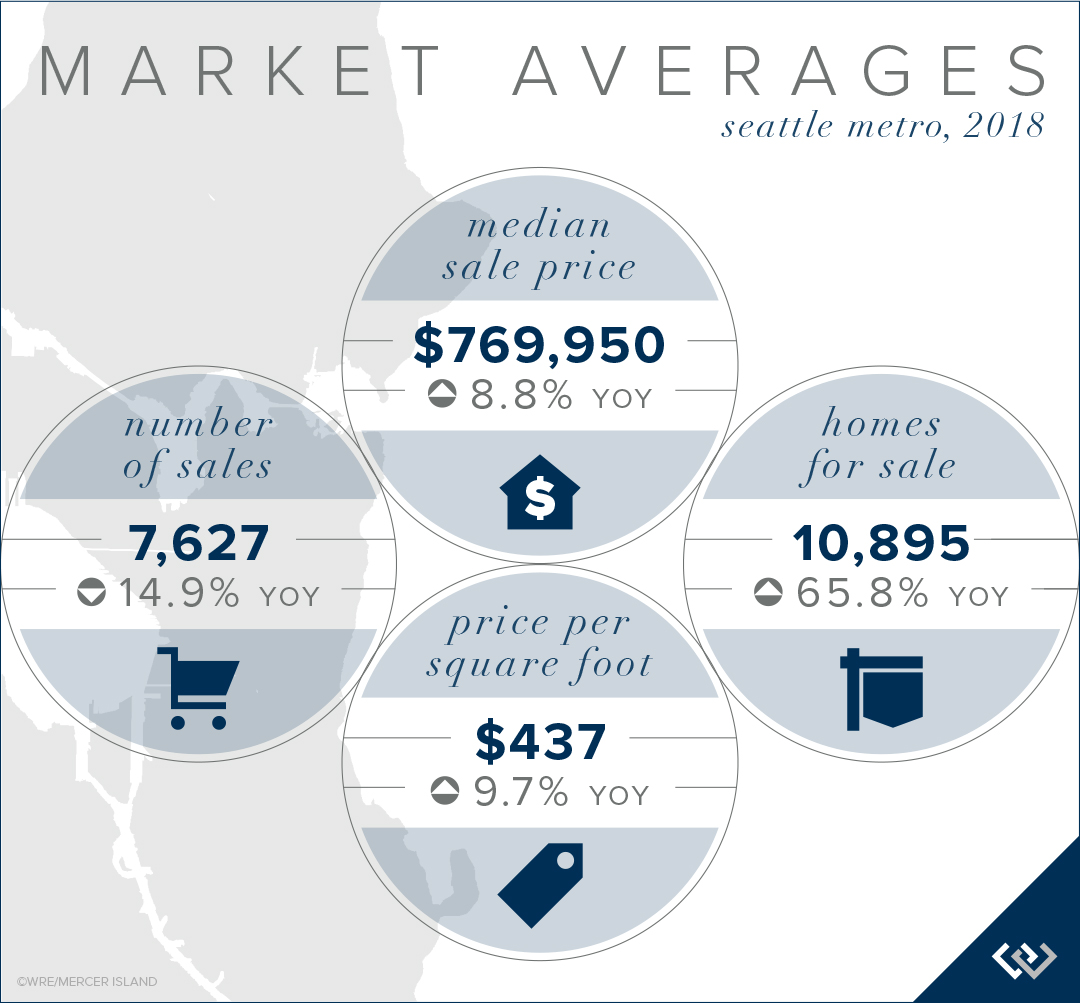
Seattle’s overall Median Sale Price was up 8.8% to $769,950, while its Average Sale Price was up 10.4% to $883,590. The Average $ Per Square Foot increased 9.7% to $437, with Lake Forest Park/Kenmore the most affordable region at $327/sq ft and Madison Park/Capitol Hill the most spendy at $561/sq ft.
Three Seattle neighborhoods had double-digit median price growth in 2018: Lake Forest Park/Kenmore at 14.4%, West Seattle at 12.7%, and Queen Anne/Magnolia at 12.2%.

Click here to view the complete report for a neighborhood by neighborhood breakdown of Average Sale Price, size, and number of homes sold.

EASTSIDE
Even with Eastside expansion announcements from several notable tech companies, 2018 saw a shift from an ultra-competitive seller’s market to a more balanced market. While the sky is not falling, price growth has slowed to a more modest and sustainable pace. After rising astronomically at the beginning of the year, prices have generally softened as buyers and sellers find their new norms.
The Eastside’s overall Median Sale Price was up 8.2% to $939,129, while its Average Sale Price was up 9.3% to $1,143,557. The higher average sale price reflects the impact of luxury home prices at the upper end of the market. The median sale price is attributed to the larger volume of mainstream sales at more moderate price points.
Four Eastside neighborhoods had double-digit median price growth in 2018: Kirkland at 23.8%, Woodinville at 12.9%, West Bellevue at 12.4%, and Mercer Island at 10.0%.

Click here for the full report and neighborhood-by-neighborhood statistics!

MERCER ISLAND
The Island, much like the region surrounding it, saw a shift from an ultra-competitive seller’s market to a more balanced market as the number of homes for sale increased markedly following a strong spring market. Home values have softened since the peak market of 2018, but still ended the year with a hefty increase over 2017 values.
The number of home sales were down in 2018: 285, as compared to 330 in 2017. Modern, turn-key homes and highly desirable settings were most sought after while those lacking essential attributes were often passed over, ending the year unsold.
Uniquely situated near both the Seattle and Eastside metro areas, the Island has always tended to fare better than most in a transitioning market. Mercer Island’s Median Sale Price was up 10.0% to $1,700,000, while its Average Sale Price was up 10.5% to $2,059,996. The higher average sale price reflects the impact of luxury home prices at the upper end of the market. The Average $ Per Square Foot increased 11.3% to $606.

Click here to view the complete report for a neighborhood by neighborhood breakdown of Average Sale Price, size, and number of homes sold.

CONDOS – SEATTLE & EASTSIDE
New construction added to the more than two-fold increase in the number of condos for sale during the year compared to 2017, from 2,131 to 4,857 units listed throughout the year. Even so, regional affordability issues drove condo desirability to all-time highs and fueled price increases that outpaced single-family homes.
Seattle’s Condo Median Sale Price was up 12.8% to $505,500, while its Average Sale Price was up 10.5% to $582,163. The Average $ Per Square Foot increased 7.5% to $601. Three regions saw increases above 20%: Richmond Beach/Shoreline at 26.8%, Ballard/Green Lake at 24.1%, and South Seattle at 24.0%.
The Eastside’s Condo Median Sale Price was up 17.2% to $480,500, while its Average Sale Price was up 17.0% to $576,061. The Average $ Per Square Foot increased 13.5% to $453. Two regions saw increases above 20%: East Bellevue at 34.0% and Kirkland at 25.0%.
Check out all of these factoids and more in the full condo report.

WATERFRONT
While the number of sales in 2018 was down markedly compared to recent years as a result of fewer international buyer purchases, a handful of notable sales drove value markers up, creating the artificial appearance of appreciation when price growth was relatively flat in 2018. Those sales include three Media and Points properties sold above $14 M, a record Lake Sammamish sale above $11 M, a Mercer Island sale above $13 M, and a Laurelhurst sale at $11 M.
This top-level overview of the entire Seattle-Eastside private waterfront market, including Mercer Island and Lake Sammamish, provides a glance into the trends occurring in our region over time. Interesting, and certainly insightful, it in no way replaces an in-depth analysis on waterfront value provided by a savvy broker with years of local waterfront experience.
Check out the full Waterfront Report for a complete list of waterfront home sales by address and community.

ABOUT WINDERMERE MERCER ISLAND
We earn the trust and loyalty of our brokers and clients by doing real estate exceptionally well. The leader in our market, we deliver client-focused service in an authentic, collaborative and transparent manner and with the unmatched knowledge and expertise that comes from decades of experience.
© Copyright 2019, Windermere Real Estate/Mercer Island. Information and statistics derived from Northwest Multiple Listing Service and deemed accurate but not guaranteed.
2018 Holiday Happenings in the Seattle Area

Our Northwest holidays may be wet, but they’re still bright! Make the most of the season with Seattle favorites—such as dazzling light displays and the Parade of Boats—along with new additions like the “Enchant” event with light mazes and ice skating inside Safeco field. Scroll down for all the details…
WildLights at Woodland Park Zoo
5500 Phinney Ave. N, Seattle, WA 98103
www.zoo.org/zoolights
click here to get tickets
- Dates/Times: Open nightly 11/23/18 – 1/5/19 | 5:30 – 8:30 pm
- Cost: $9.95 – $14.95 per person (ages 2 and under are free)
- Promotion: Get a 10% group discount on WildLights tickets for groups of 20+ (12/14/18 – 1/5/19).
- Parking: Free parking is available at all lots after 4:30 pm (admission at both gates)
- Food: Refreshments are available at food kiosks, Pizza Corner, and at the Pacific Blue Chowder House (with covered seating provided). You are also welcome to bring your own food and non-alcoholic beverages.
- Special activities: Carousel, fire pits, select indoor animal exhibits, ZooStore, & indoor snowball fights at the Snowmazium
- Closures: December 12, 24 & 25, 2018
Image courtesy of https://zoo.org/zoolights
Winterfest at Seattle Center
305 Harrison Street, Seattle, WA 98109
www.seattlecenter.com/winterfest
Map
- Dates/Times: Winter train & village open daily 11/23/18 – 12/31/18 | 10 am – 6 pm
Winterfest Ice Rink open 11/23/18 – 1/6/19, Sun-Thu from 11 am – 8 pm, Fri-Sat from 11 am – 10 pm - Cost: Free for all ages (ice skating is $2 – $8 including rental)
- Parking: Paid parking available at the Mercer Garage, 1st Ave N Garage, 5th Ave N Garage, and Theatre Commons Lot. Click here for the campus map
- Food: A multitude of dining options await you in the Armory
- Special events: Ice skating at the Winterfest Ice Rink, ice sculpting, caroling, the Winter Train & Village, and more!
- Holiday Closure: 12/25
Enchant at Safeco Field
1250 1st Ave S, Seattle, WA 98134
https://enchantchristmas.com/seattle/
click here to get tickets
- Dates/Times: 11/23/18 – 12/30/18 | Sun-Thu from 4 – 10 pm, Fri-Sat from 4 – 11 pm
- Cost: $19 – $32.99 per person (ages 3 and under are free) | VIP passes with dinner starting at $64.99
- Promotions: Discount days on 11/27, 12/4 & 12/11 | Discount on final 2 hours of any day | Group discounts for 15 or more
- Parking: $8 – $60 at Safeco Field Garages or check out the city’s Interactive Parking Map
- Food: Seasonal food and treat concessions throughout
- Activities: Ice skating trail, light maze, visits with Santa & Mrs. Claus, nightly live music & shows, gift market
- Closures: 11/26, 12/3 & 12/10

Garden d’Lights at Bellevue Botanical Garden
12001 Main Street, Bellevue WA 98005
https://bellevuebotanical.org/garden-dlights/
click here to get tickets
- Dates/Times: Open nightly 11/24/18 – 12/30/18 | 4:30 – 9:00 pm
- Cost: $5 per person (ages 10 and under are free)
- Promotion: Free admission nights on November 24, 25, 26, 27, 28 & 29
- Parking: Premium parking is $5 per car in the Garden’s lot (cash only) as space allows OR park for free at Wilburton Hill Park
- Food: Hot drinks and snacks are available at the Aaron Education Center
- Activities: Gingerbread village, live music
- Holiday Closures: None

Image courtesy of https://gardendlights.org/
Snowflake Lane at the Bellevue Collection
Bellevue Way & NE 8th Street, Bellevue WA 98004
http://snowflakelane.com/
- Dates/Times: Nightly 11/23/18 – 12/24/18 | 20 minute show starts at 7 pm
- Cost: Free for all ages
- Parking: Free parking at Bellevue Square, Bellevue Place and Lincoln Square
- Food: A variety of dining options (from happy hour, to kid fare, to gourmet meal) are all within walking distance
- Special Events & Activities: Ice Skating, Santa Parade & Tree Lighting, Santa Photos
Image courtesy of http://bellevue.com/snowflake-lane
Christmas Ship Festival
Launch locations include Lake Union Park, Kirkland City Dock, Hyatt Regency Lake Washington, Des Moines Marina, Port of Poulsbo, Seattle Waterfront – Pier 55, Tacoma (Dock Street Marina), Edmonds, and Shilshole Bay Marina
www.argosycruises.com
click here to get tickets
- Dates/Times: Click here for the full schedule
- Cost: $22 – $68 per person (kids 3 and under are free)
- Parking: Varies by location – click here for details
- Food: While dining ahead of time is recommended, there are snacks and drinks available for purchase on the ship. You can also pre-order Ingallina’s boxed meals (with vegetarian and gluten-free options) at least 72 hours prior to your cruise. Outside food/drinks are not allowed.
- Special Events: Parade of Boats Night, Kid Cruise, Grand Finale Night
Ivar’s Clam Lights at Gene Coulon Memorial Beach Park
1201 Lake Washington Blvd N, Renton, WA 98056
https://rentonwa.gov/clamlights
- Dates/Times: Open nightly 11/30/18 – 1/1/19 | 5 – 9 pm
- Cost: Free for all ages
- Parking: Park for free at the Gene Coulon Memorial Beach Park parking lot
- Kickoff Event on November 30th, 2018, 5:30-8:30: Music, selfie-station with Santa & Mrs. Claus in their sleigh, official lighting ceremony, Parade of Boats viewing, and a visit from the Christmas Ship and Dickens Carolers
- Holiday Closures: None
Image courtesy of https://rentonwa.gov/clamlights
Westlake Center Tree Lighting & Holiday Activities
400 Pine St., Seattle, WA 98101 (Westlake Park)
http://redtri.com/seattle/westlake-center-tree-lighting/
- Dates/Times: Tree lighting ceremony on 11/23/18 at 4:30 pm. Holiday market Fri-Sun beginning 11/23 through 12/23. Carousel and other festive attractions through January 1st, 2019
- Cost: Free for all ages
- Parking: Access the Republic Parking garage from Olive Way between 4th & 5th Ave, or check out this interactive map of city parking
- Activities: Carousel, Holiday Market at Westlake Park
Image courtesy of http://redtri.com
Zoolights at Point Defiance Zoo & Aquarium
5400 N Pearl St, Tacoma, WA 98407
www.pdza.org/event/zoolights
click here to get tickets
- Dates/Times: Open nightly 11/23/2018 – 1/6/2019 | 5 – 9 pm
- Cost: $10-$12 (free for kids 2 & under)
- Promotions: $6 for zoo members; Scout discount night 12/4; Military discount nights Nov. 26, 28 & Dec. 3, 5, 10, 12, 17, & 19
- Parking: Free parking in zoo lots (carpooling recommended)
- Food: Warm drinks & treats available at the cafe and kiosks
- Activities: Camel rides, carousel, aquarium, Kids’ Zone with animals
- Holiday Closure: 12/24
Image courtesy of https://www.pdza.org
ABOUT WINDERMERE MERCER ISLAND
We earn the trust and loyalty of our brokers and clients by doing real estate exceptionally well. The leader in our market, we deliver client-focused service in an authentic, collaborative and transparent manner and with the unmatched knowledge and expertise that comes from decades of experience.
© Copyright 2018, Windermere Real Estate/Mercer Island.
